الوصف
═══════════════════════════════════════════════════════════════
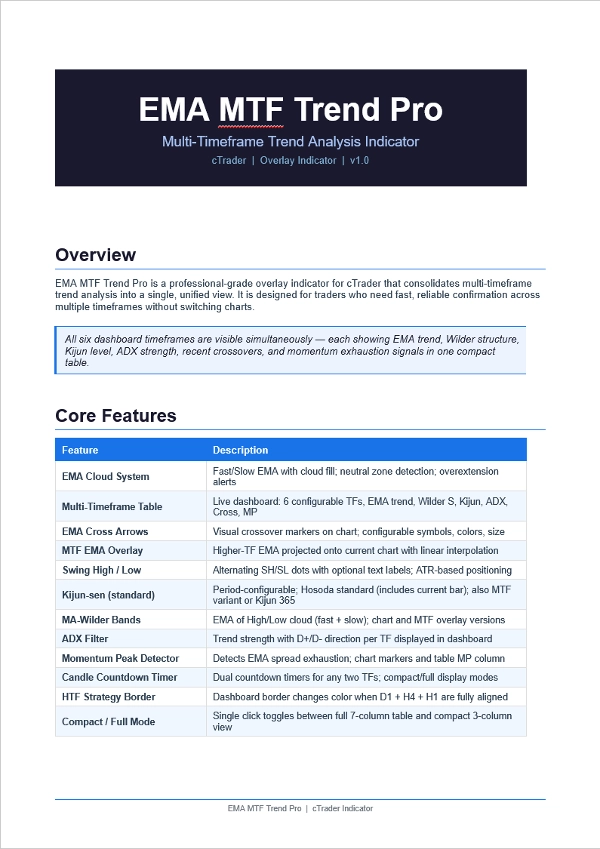
EMA MTF TREND PRO — مؤشر تحليل الاتجاه متعدد الأطر الزمنية
مؤشر تراكب cTrader
═══════════════════════════════════════════════════════════════
شاهد الصورة الكاملة للاتجاه عبر 6 أطر زمنية — في جدول واحد،
على مخطط واحد، دون الحاجة لتبديل النوافذ.
───────────────────────────────────────────────────────────────
ما الذي يفعله
───────────────────────────────────────────────────────────────
يجمع EMA MTF Trend Pro بين اتجاه اتجاه EMA، هيكل قناة Wilder،
مستويات Kijun-sen، قوة ADX، إشارات التقاطع،
ونفاد الزخم في لوحة تحكم حية واحدة.
كل صف في الجدول يمثل إطارًا زمنيًا مختلفًا. كل عمود
يجيب عن سؤال مختلف حول ذلك الإطار الزمني. نظرة واحدة
تخبرك ما إذا كانت الأطر الزمنية متفقة — وما إذا كان من الآمن
الدخول.
───────────────────────────────────────────────────────────────
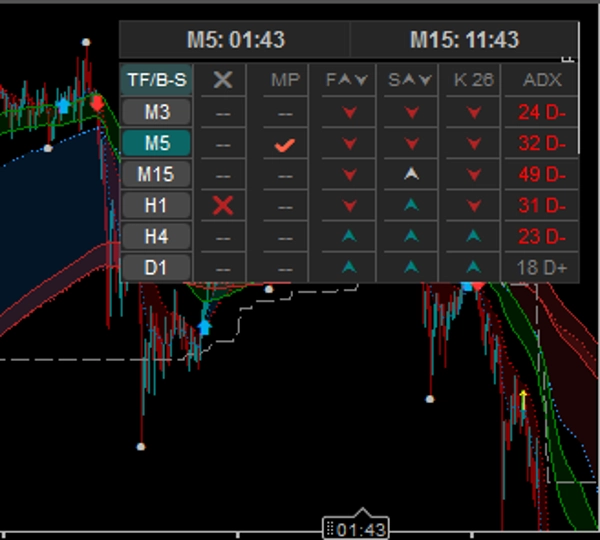
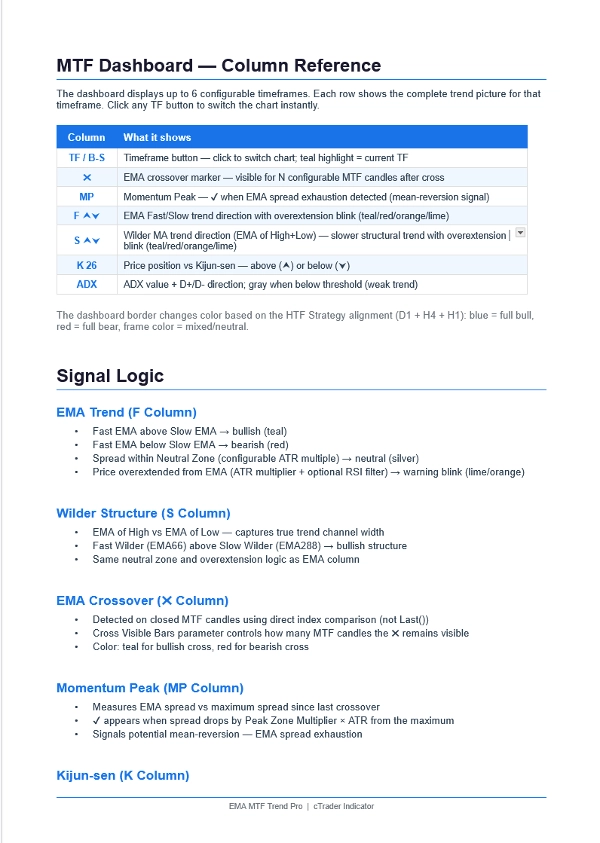
لوحة التحكم — 6 أطر زمنية × 7 أعمدة
───────────────────────────────────────────────────────────────
العمود ما يعرضه
──────── ──────────────────────────────────────────────────
زر الإطار الزمني TF/B-S — انقر للتبديل الفوري للمخطط
التمييز باللون الفيروزي = الإطار الزمني المعروض حاليًا
✖ تقاطع EMA — مرئي لعدد N من الشموع القابلة للتكوين
الفيروزي = تقاطع صعودي | الأحمر = تقاطع هبوطي
MP ذروة الزخم — ✔ عندما يكون انتشار EMA مستنفدًا
إشارة تحذير للارتداد المتوسط
F ⮝⮟ اتجاه الاتجاه السريع مقابل البطيء لـ EMA
الفيروزي = صعود | الأحمر = هبوط | الفضي = محايد
يومض عندما يكون السعر مفرطًا بعيدًا عن EMA
S ⮝⮟ هيكل MA لـ Wilder (EMA للارتفاع/الانخفاض)
مرشح اتجاه أبطأ وأكثر هيكلية
K 26 السعر مقابل Kijun-sen
⮝ = السعر فوق (دعم) | ⮟ = تحت (مقاومة)
ADX قوة الاتجاه + اتجاه D+/D-
الرمادي = سوق ضعيف/متقلب (أدنى من العتبة)
───────────────────────────────────────────────────────────────
الميزات
───────────────────────────────────────────────────────────────
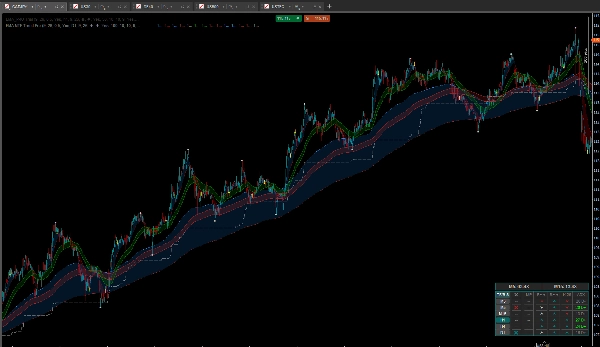
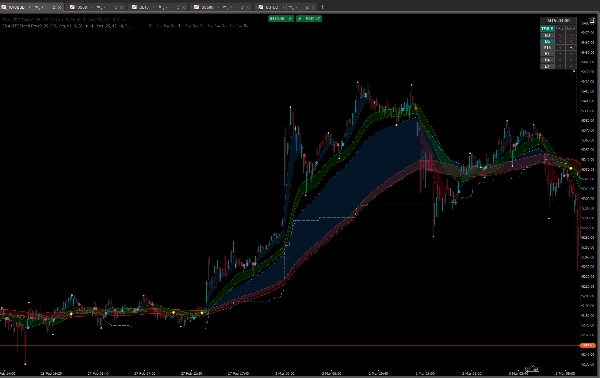
نظام سحابة EMA
• EMA سريع + بطيء مع تعبئة سحابية ملونة
• اكتشاف المنطقة المحايدة (مضاعف ATR قابل للتكوين)
• تنبيهات التمدد الزائد مع فلتر RSI
تراكب EMA متعدد الأطر الزمنية
• عرض أي EMA لإطار زمني أعلى على المخطط الحالي
• استيفاء خطي — خطوط ناعمة، بدون خطوات
• أسهم التقاطع مع رموز وألوان قابلة للتكوين
• يخفي تلقائيًا أسهم التراكب عند اختيار إطار زمني أعلى
في لوحة التحكم (يمنع الفوضى البصرية)
قمم وقيعان التأرجح
• نقاط SH / SL متناوبة — لا توجد قمم متتالية مكررة
• تسميات نصية اختيارية لـ SH / SL مع تحديد موقع قائم على ATR
• حجم النقطة، حجم التسمية، الألوان قابلة للتكوين
• مفتاح تشغيل/إيقاف واحد لعرض التأرجح بالكامل
Kijun-sen
• تعريف Hosoda القياسي (مطابق لـ TradingView / MT4)
• فترة قابلة للتكوين
• متوفر أيضًا كخط تراكب متعدد الأطر الزمنية على المخطط
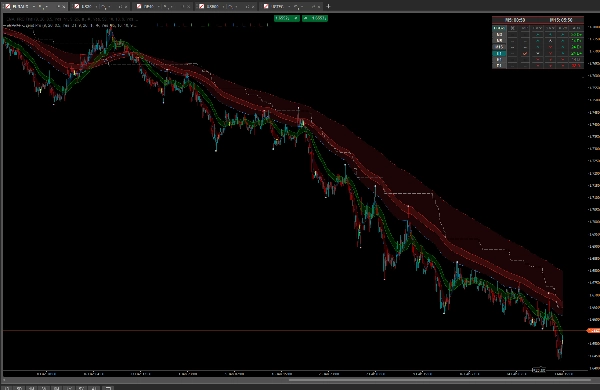
أشرطة MA-Wilder
• EMA للارتفاع وEMA للانخفاض — ينشئ قناة اتجاه
• شريط سريع (EMA66) + شريط بطيء (EMA288)
• متوفر على المخطط وكخط تراكب متعدد الأطر الزمنية
حدود استراتيجية الإطار الزمني العالي
• يتحول حد لوحة التحكم إلى الفيروزي عندما يكون D1 + H4 + H1
جميعها صاعدة (EMA + Wilder متوافقة)
• يتحول إلى الأحمر عندما تكون الثلاثة هابطة
• تأكيد بصري فوري للتوافق الكامل متعدد الأطر الزمنية
مؤقت العد التنازلي للشموع
• مؤقتان — أي إطارين زمنيَين
• يمكن للمؤقت الثاني متابعة إطار المخطط الحالي
• تخطيط مضغوط في وضع العمود الواحد
الوضع المضغوط / الكامل
• انقر على رأس TF/B-S للتبديل
• الوضع الكامل: 7 أعمدة (جميع الإشارات)
• الوضع المضغوط: 3 أعمدة (TF، EMA، Wilder) — مساحة قليلة
───────────────────────────────────────────────────────────────
الاستراتيجية — كيفية الاستخدام
───────────────────────────────────────────────────────────────
الخطوة 1 — تحديد التحيز (الأطر الزمنية الأعلى)
• صف D1: F ⮝ + S ⮝ = هيكل يومي صاعد
• صف H4: نفس الاتجاه = تم تأكيد الاتجاه
• يتحول حد لوحة التحكم إلى الفيروزي = اتفاق D1 + H4 + H1
الخطوة 2 — إيجاد الدخول (الإطار الزمني الأدنى)
• انقر على H1 أو M15 في الجدول لتبديل المخطط
• انتظر تقاطع ✖ في نفس اتجاه تحيز الإطار الزمني الأعلى
• يعرض عمود K ⮝ (السعر فوق Kijun) للصفقات الطويلة
• عمود ADX نشط، ليس رماديًا (الاتجاه قوي)
الخطوة 3 — التصفية باستخدام ذروة الزخم
• يعرض عمود MP ✔ → انتشار EMA مستنفد → تجنب الدخول
• انتظر حتى يختفي MP (--) قبل الدخول
• استخدم على الأطر الزمنية الأدنى لتجنب الدخول عند أقصى EMA
الخطوة 4 — استخدام مستويات التأرجح
• نقطة SH = أعلى تأرجح حديث (مقاومة / مرجع وقف)
• نقطة SL = أدنى تأرجح حديث (دعم / مرجع هدف)
• النقاط متناوبة — دائمًا واحدة عالية، واحدة منخفضة في كل مرة
───────────────────────────────────────────────────────────────
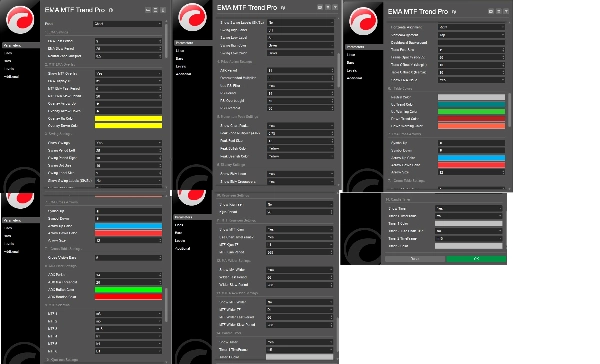
مجموعات المعلمات
───────────────────────────────────────────────────────────────
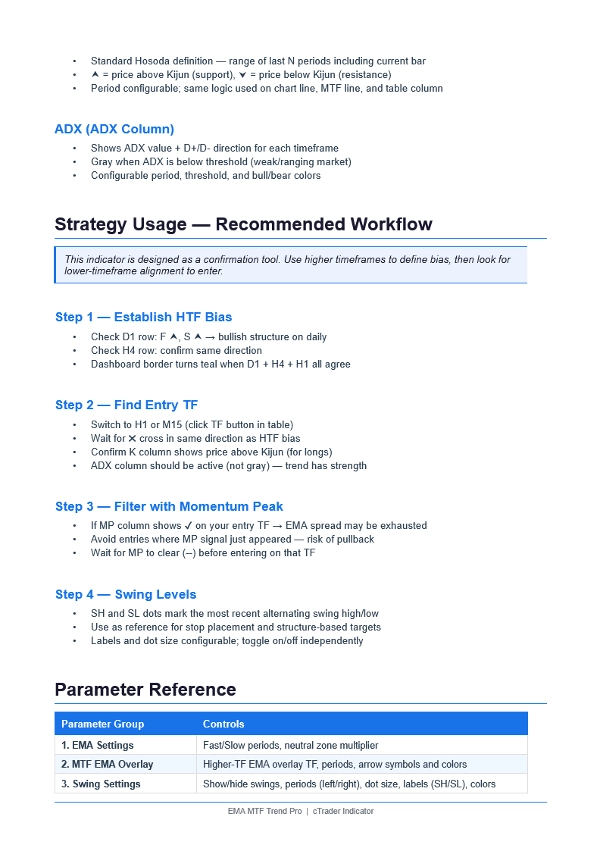
1. إعدادات EMA — فترات سريع/بطيء، المنطقة المحايدة
2. تراكب EMA متعدد الأطر الزمنية — الإطار الزمني، الفترات، نمط السهم
3. إعدادات التأرجح — إظهار/إخفاء، الفترات، التسميات، الألوان
4. حركة السعر — ATR، التمدد الزائد، فلتر RSI
5. ذروة الزخم — مضاعف المنطقة، الخط، الألوان
6. إعدادات العرض — الخطوط، السحابة، تخطيط الجدول
6.1 ألوان الجدول — تحكم كامل في لوحة الألوان
7. أسهم تقاطع EMA — الرموز، الألوان، الحجم
7.1 إعدادات جدول التقاطع — الشموع المرئية للتقاطع (N شموع)
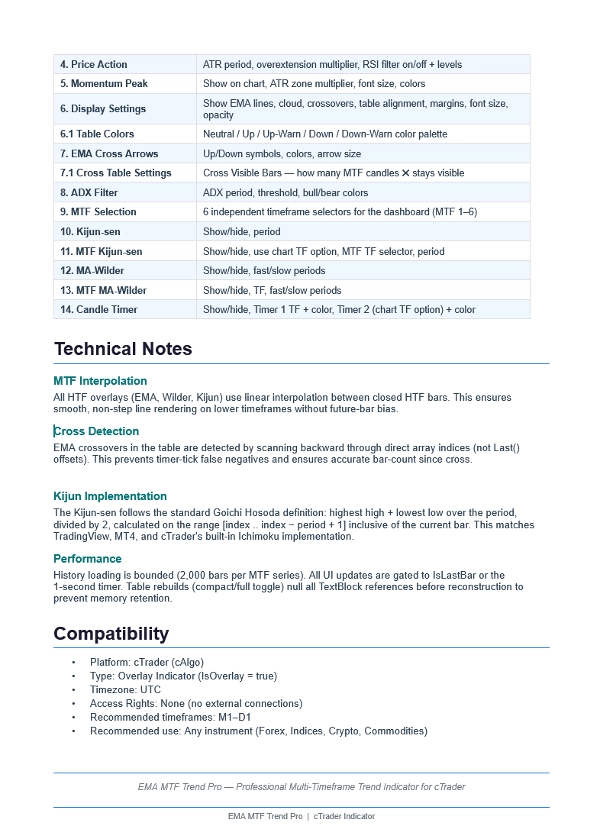
8. فلتر ADX — الفترة، العتبة، الألوان
9. اختيار متعدد الأطر الزمنية — 6 × محددات إطار زمني مستقلة
10. Kijun-sen — إظهار/إخفاء، الفترة
11. Kijun-sen متعدد الأطر الزمنية — الإطار الزمني، الفترة، خيار إطار المخطط
12. MA-Wilder — إظهار/إخفاء، فترات سريع/بطيء
13. MA-Wilder متعدد الأطر الزمنية — الإطار الزمني، فترات سريع/بطيء
14. مؤقت الشموع — الأطر الزمنية، الألوان، خيار إطار المخطط
───────────────────────────────────────────────────────────────
الملخص
تقييمات العملاء
5 | 0 % | |
4 | 100 % | |
3 | 0 % | |
2 | 0 % | |
1 | 0 % |