
Descrição
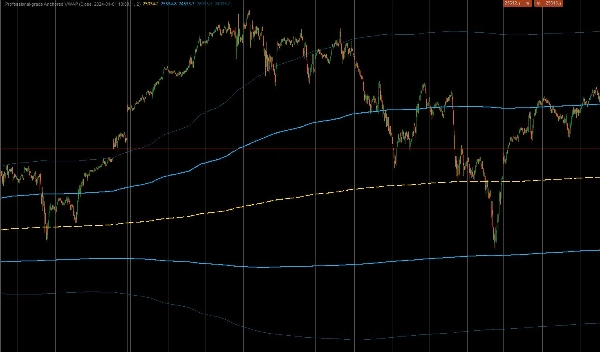
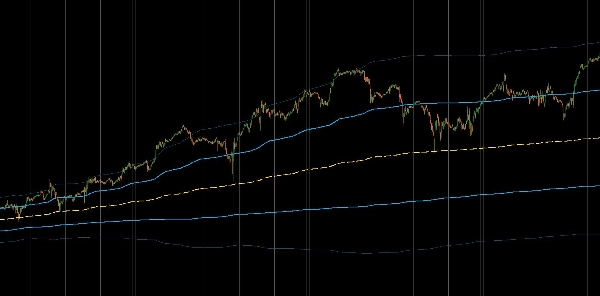
Este é um indicador personalizado de nível profissional para cTrader projetado para calcular o Preço Médio Ponderado por Volume Ancorado (AVWAP). Ao contrário dos indicadores VWAP padrão que reiniciam diariamente, esta ferramenta permite que os traders "ancorem" o cálculo a um evento específico de alto impacto — como a divulgação do CPI, uma queda no mercado ou o início de uma tendência — fornecendo uma visão institucional verdadeira do preço médio desde aquele momento. Também inclui Bandas de Desvio Padrão Ponderadas por Volume para identificar ações de preço excessivamente estendidas.
1. Cálculo Principal e Lógica de Ancoragem
- Ancoragem de Precisão: O indicador utiliza uma
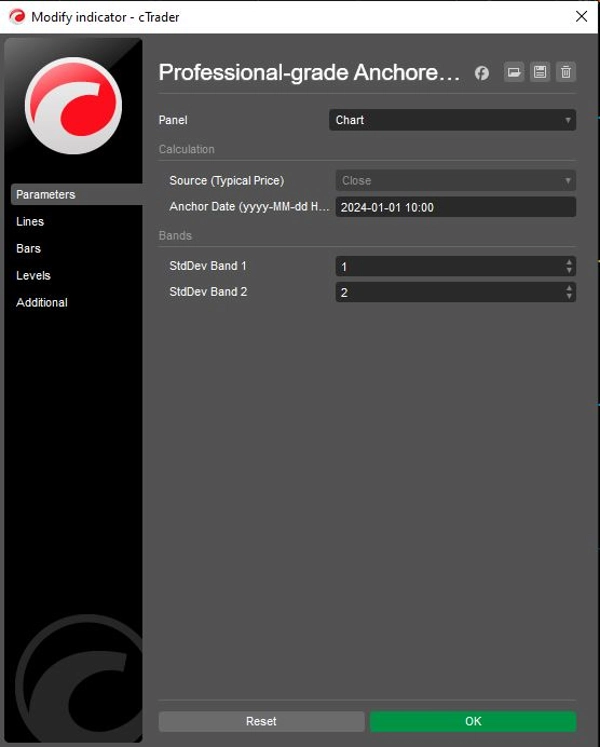
Data de Ancoragemdefinida pelo usuário (por exemplo, "2024-01-01 10:00") para ignorar estritamente todos os dados anteriores a esse minuto específico. Isso garante que o preço médio reflita apenas os participantes envolvidos no movimento ou período atual específico. - Fórmula Institucional: Calcula o verdadeiro VWAP usando a soma cumulativa de (Preço × Volume) dividida pela soma cumulativa do Volume.
- Fonte de Preço Típica: Por padrão, utiliza o
"Preço Típico"(High + Low + Close) / 3para os cálculos, que é o método padrão usado por algoritmos institucionais para determinar o valor justo, embora possa ser ajustado para preços de Abertura ou Fechamento.
2. Bandas Avançadas de Volatilidade
Para ajudar os traders a avaliar extremos de mercado, o indicador calcula dois conjuntos de bandas dinâmicas baseadas em Variância Ponderada por Volume:
- Banda 1 (A Zona de Valor): Padrão para 1,0 Desvio Padrão. Esta zona interna normalmente contém o "ruído" do valor justo do mercado. Uma ruptura desta zona frequentemente sinaliza momentum.
- Banda 2 (A Zona Extrema): Padrão para 2,0 Desvios Padrão. Preços que alcançam esta banda externa estão estatisticamente excessivamente estendidos, frequentemente sinalizando oportunidades potenciais de reversão à média (desvanecer o movimento) ou forte exaustão de tendência.
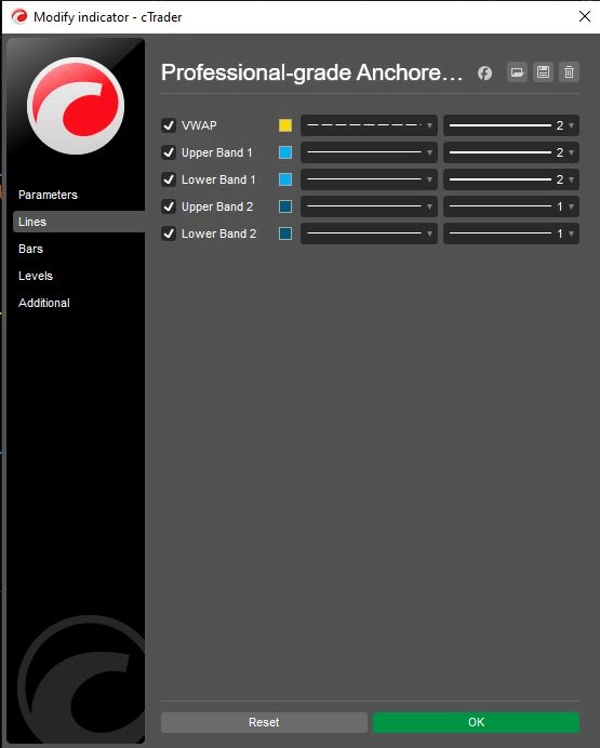
- Controle Independente: Ambas as bandas incluem alternâncias individuais de
Mostrar(ShowBand1,ShowBand2) e multiplicadores de desvio personalizáveis (Band1Dev,Band2Dev), permitindo gráficos limpos adaptados a estratégias específicas de volatilidade.
3. Lógica Visual e Operacional
- Codificação Estratégica de Cores:
-
- Amarelo (VWAP): Atua como o "ímã" central ou linha base da tendência.
- Verde Lima (Banda 1): Representa a "Área de Valor" de suporte/resistência imediata.
- Vermelho (Banda 2): Destaca desvios extremos onde a probabilidade de reversão aumenta.
- Preservação de Estado: O código utiliza
IndicatorDataSeriespara variáveis internas de estado (_cumVol,_cumPV), garantindo que os valores permaneçam precisos durante recálculos históricos e atualizações em tempo real sem erros de repintura.
Resumo do Fluxo Lógico
- Inicializar: Analise a string específica da Data de Ancoragem do usuário em um objeto DateTime do sistema.
- Filtrar Tempo: Para cada barra, verifique se o tempo atual é anterior à Ancoragem. Se for, retorne
NaN(não desenhe nada) e redefina os contadores cumulativos para zero. - Acumular Dados: Uma vez que o tempo da Ancoragem seja alcançado, comece a adicionar o Volume da barra atual e (Preço × Volume) ao total acumulado.
- Calcular VWAP: Divida o Total PV Acumulado pelo Total de Volume Acumulado para obter a linha VWAP.
- Calcular Variância: Calcule a variância ponderada por volume e derive o Desvio Padrão.
- Plotar Bandas: Adicione/Subtraia o Desvio calculado do VWAP para plotar as bandas Verde Lima e Vermelha.
Resumo
Key features include:
- Precision anchoring to a user-specified date and time, ignoring data before that moment.
- Institutional VWAP calculation using cumulative (Price × Volume) divided by cumulative Volume.
- Default use of Typical Price ((High + Low + Close) / 3) for fair value, adjustable to Open or Close prices.
- Two dynamic volatility bands based on volume-weighted variance: Band 1 (1 standard deviation) representing the value zone, and Band 2 (2 standard deviations) indicating extreme price deviations.
- Independent toggles and customizable deviation multipliers for each band.
- Strategic color coding: yellow for VWAP, lime green for Band 1, and red for Band 2.
- Internal state preservation ensures accurate values during historical and real-time updates without repainting.
The indicator supports markets including Forex, indices, commodities, stocks, and cryptocurrencies, and is suitable for various symbols such as BTCUSD, EURUSD, GBPUSD, XAUUSD, and NAS100.
Avaliações de clientes
5 | 50 % | |
4 | 50 % | |
3 | 0 % | |
2 | 0 % | |
1 | 0 % |


