
설명
고정 범위 볼륨 프로필(FRVP) 사용 방법
- 지표 활성화: cTrader Automate 또는 Indicators 메뉴에서 원하는 차트로 FRVP 지표를 드래그 앤 드롭하세요.
- 분석 도구 선택: cTrader 툴바(일반적으로 플랫폼의 오른쪽 또는 왼쪽)에 있는 표준 사각형 그리기 도구를 찾으세요.
- 범위 정의: 분석하려는 특정 가격 움직임과 기간 위에 사각형을 클릭하고 드래그하세요.
- 프로필 초기화: 그리기 후, 사각형을 약간 클릭하고 밀어주세요. 이 그리기와 지표 간의 "악수"가 볼륨 계산을 트리거하여 즉시 히스토그램, POC 및 가치 영역 라인을 생성합니다.
- 동적 조정: 사각형의 가장자리를 드래그하여 시간 범위를 확장하거나 다른 가격 구간으로 이동할 수 있으며, 볼륨 프로필은 새 영역을 반영하도록 자동으로 재계산됩니다.
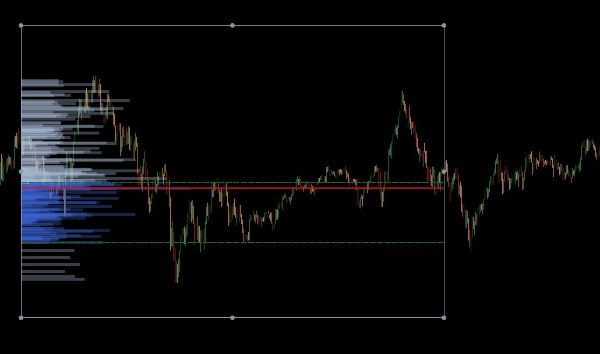
cTrader용 고정 범위 볼륨 프로필(FRVP)은 특정 시간 및 가격 범위 내에서 볼륨 분포를 계산하여 중요한 가격 수준을 식별하도록 설계된 정교한 분석 도구입니다. 시간에 대응하는 표준 볼륨 지표와 달리, 이 지표는 가격 밀도에 초점을 맞춰 시장 심리를 드러냅니다.
핵심 기능
- 동적 범위 선택: 표준 사각형을 cTrader 차트에 그리거나 이동할 때마다 지표가 자동으로 계산 및 업데이트됩니다.
- 주요 수준 식별:
-
- 통제점(POC): 가장 많이 거래된 볼륨의 가격 수준을 강조하며, 가격 움직임의 "자석" 역할을 합니다.
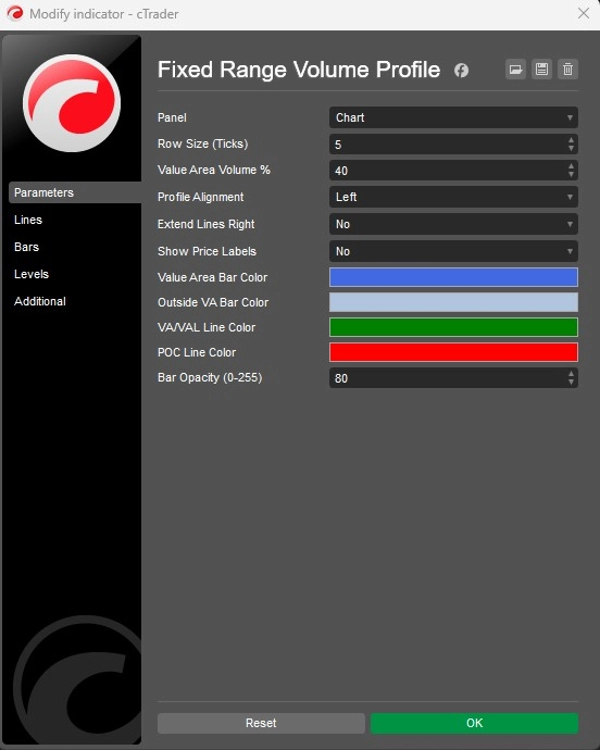
- 가치 영역 고가/저가(VAH/VAL): 특정 비율의 볼륨(기본값 40%)이 거래된 경계를 정의합니다.
- 사용자 정의 가능한 레이아웃:
-
- 정렬: 상자의 왼쪽 또는 오른쪽에서 볼륨 히스토그램을 표시하도록 선택할 수 있습니다.
- 세분화: 볼륨 막대의 세부 조절을 위해 행 크기(기본값 5틱)를 조정할 수 있습니다.
- 시각적 요소: 막대 색상(가치 영역 대 외부), 불투명도, 가격 라벨 가시성에 대한 완전한 제어가 가능합니다.
전략적 활용
- 지지 및 저항: 고볼륨 노드(HVN)는 강력한 지지 또는 저항 역할을 하는 반면, 저볼륨 노드(LVN)는 가격이 빠르게 움직일 수 있는 "얇은" 영역을 나타냅니다.
- 추세 확인: 오른쪽 확장 기능을 사용하여 과거 볼륨 수준이 현재 가격 움직임과 어떻게 상호작용하는지 확인할 수 있습니다.
요약
AI 요약
The Fixed Range Volume Profile (FRVP) indicator for cTrader analyzes volume distribution within a user-defined price and time range using a standard rectangle drawing tool. By selecting and adjusting this rectangle on the chart, the indicator dynamically calculates and displays a volume histogram along with key levels: Point of Control (POC), which marks the price with the highest traded volume, and Value Area High/Low (VAH/VAL), defining the volume concentration boundaries. Users can customize the histogram’s alignment, granularity (row size), colors, opacity, and price label visibility. The indicator supports dynamic range adjustments by dragging the rectangle edges, automatically recalculating volume data. Strategically, it helps identify support and resistance zones through high and low volume nodes and offers trend confirmation by extending volume levels into current price action. The FRVP is applicable across various markets including Forex, cryptocurrencies, commodities, indices, and stocks, and supports symbols such as BTCUSD, EURUSD, GBPUSD, XAUUSD, and NAS100. It integrates with cTrader’s drawing tools and provides a detailed volume-based perspective on price action beyond standard time-based volume indicators.
지표 프로필
고객 리뷰
4.0
리뷰: 2
5 | 0 % | |
4 | 100 % | |
3 | 0 % | |
2 | 0 % | |
1 | 0 % |
상담
자주 묻는 질문(FAQ)
BTCUSD
Forex
Signal
Breakout
Indices
EURUSD
Commodities
GBPUSD
NZDUSD
Fibonacci
Prop
Scalping
Fair Value Gap
SMC
Crypto
Stocks
XAUUSD
NAS100
USDJPY
VWAP
트레이딩 봇, 지표, 플러그인 등 cTrader Store에서 제공되는 상품은 제3자 개발자에 의해 제공되며, 이는 단순히 정보 및 기술적 접근을 목적으로 제공된 것입니다. cTrader Store는 중개인이 아니며, 투자 조언, 개인별 추천 또는 향후 성과에 대한 어떠한 보장도 제공하지 않습니다.
이 작성자의 상품 더 보기


!["[Hamster-Coder] Pivot Points MTF" 로고](https://cdn.ctrader.com/image/webp/4c143e5a-309c-40e3-a578-f04d1e133ffa_31159)


가격
가입일 26/09/2025
14
판매