
Volume Profile Pro
مؤشر
8 عمليات الشراء
الإصدار 1.0، Oct 2025
Windows, Mac
5.0
التقييمات: 3
الوصف
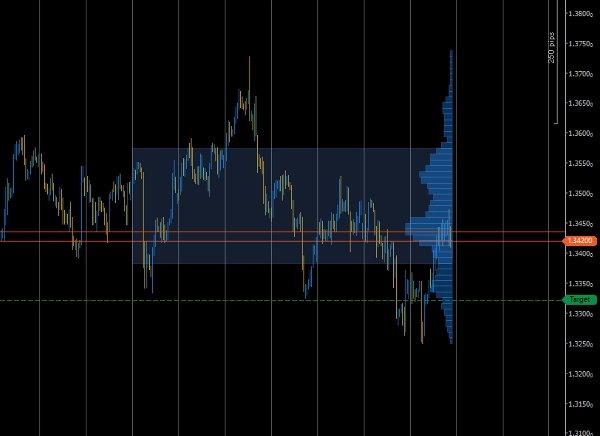
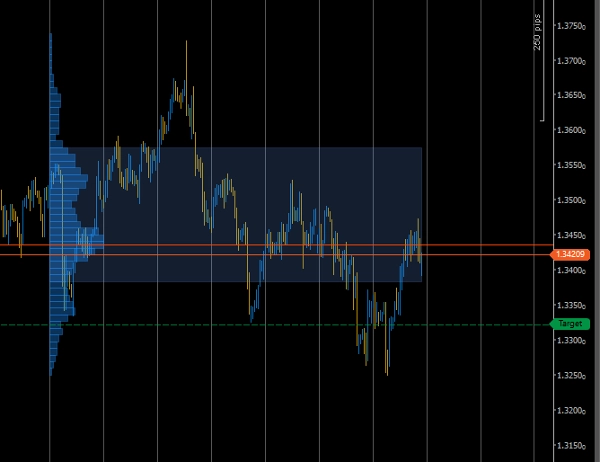
Volume Profile Pro هو أداة تحليل حجم احترافية ذات نطاق ثابت مصممة لرسم هيكل السوق والسيولة بدقة.
تتيح لك تصور كمية النشاط التجاري التي حدثت عند كل مستوى سعري ضمن نطاق مخطط محدد — مما يساعدك على تحديد مناطق الاهتمام فورًا مثل العقد ذات الحجم العالي، ونقطة التحكم (POC)، ومنطقة القيمة 70%.
الميزات الرئيسية
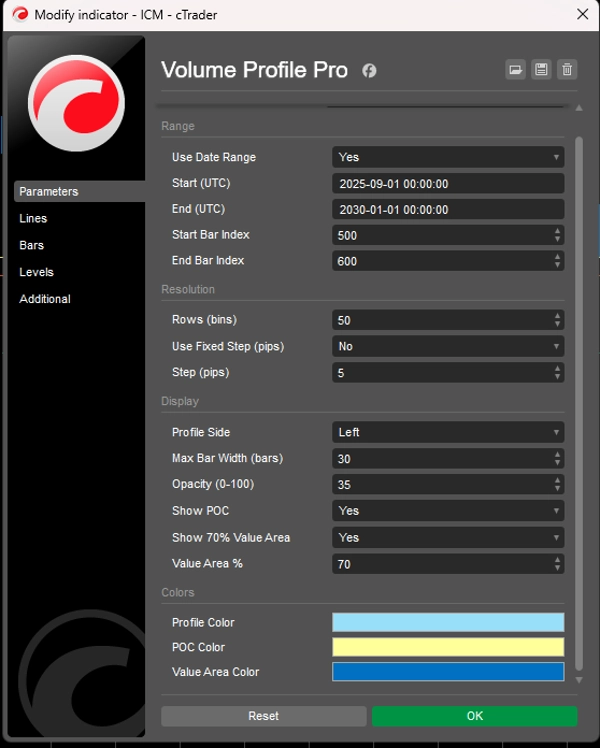
- 🧭 اختيار النطاق الثابت – حدد نطاقًا مخصصًا حسب التاريخ أو مؤشر الشمعة لتحليل المنطقة التي تهمك فقط.
- 📊 توزيع حجم دقيق – يبني مخططًا بيانيًا للحجم من حجم التيك عبر النطاق المختار.
- 🎯 نقطة التحكم ومنطقة القيمة – يبرز تلقائيًا نقطة التحكم وشريط منطقة القيمة بنسبة 70%.
- ⚙️ دقة مرنة – عدد صناديق قابل للتعديل أو خطوة ثابتة بالبيب لتحديد الدقة حسب الرغبة.
- 🎨 تصور نظيف – اختر الجانب (يسار/يمين)، مقياس العرض، والتعتيم لقراءة مثالية للمخطط.
- ⚡ خفيف الوزن ومحسن – حساب فعال لدراسات الحجم في الوقت الحقيقي دون إبطاء جهازك.
كيف يعمل
- اختر ما إذا كنت تريد استخدام نطاق التاريخ أو نطاق مؤشر الشمعة.
- حدد معلمات البداية / النهاية الخاصة بك.
- يقوم المؤشر بحساب حجم التيك عند كل خطوة سعر ويرسم أشرطة أفقية تظهر النشاط النسبي.
- تشير أطول شريط إلى نقطة التحكم، وتُظهر منطقة مظللة بخفة منطقة القيمة (الافتراضي 70%).
مثالي لـ
- المتداولين اليوميين والمتأرجحين الذين يحللون تركيز السيولة.
- مطورين استراتيجيات تعتمد على الحجم الباحثين عن مناطق مدفوعة بالبيانات.
- المتداولين الذين يستخدمون انعكاسات/تلاقيات نقطة التحكم أو منطقة القيمة.
الملخص
ملخص الذكاء الاصطناعي
Volume Profile Pro is a fixed-range volume analysis indicator designed to visualize trading volume distribution by price within a user-defined chart range. It calculates tick volume at each price level and displays a horizontal histogram that highlights key market structure elements such as the Point of Control (POC)—the price with the highest traded volume—and the 70% Value Area, representing the price range where most trading activity occurred. Users can select the analysis range by date or bar index and adjust the resolution through customizable bin counts or fixed pip steps. The indicator offers flexible visualization options, including side placement, width scaling, and opacity adjustments, to enhance chart readability. Its efficient computation supports real-time volume studies without impacting terminal performance. Volume Profile Pro is suitable for intraday and swing traders, volume-based strategy developers, and those utilizing POC or Value Area levels for trading decisions. It supports multiple markets and symbols, including Forex pairs (EURUSD, GBPUSD, NZDUSD, USDJPY), cryptocurrencies (BTCUSD), commodities (XAUUSD), indices (NAS100), and stocks.
ملف تعريف المؤشر
تقييمات العملاء
5.0
التقييمات: 3
5 | 100 % | |
4 | 0 % | |
3 | 0 % | |
2 | 0 % | |
1 | 0 % |
تقييمات العملاء
October 20, 2025
Practical market note if the trader wants it adds useful information behind the price move. It works best as support, not a final decision maker. Volume context is stronger when POC, VWAP and value area agree across 2 sessions. volume alone can be noisy without price action.
October 19, 2025
October 19, 2025
Focused demo option for traders who want confirmation beyond candles. It gives value around volume based context, but volume alone can be noisy without price action. I would review 20 reactions near POC or VWAP before trusting the read. The data helps most when price action confirms the same zone.
مناقشة
الأسئلة الشائعة
BTCUSD
Prop
Forex
Indices
Commodities
Crypto
Stocks
يتم توفير المنتجات المتاحة من خلال cTrader Store، بما في ذلك روبوتات التداول والمؤشرات والإضافات، من قبل مطوري الطرف الثالث وإتاحتها لأغراض الوصول المعلوماتي والفني فقط. cTrader Store ليس وسيطًا ولا يقدم نصائح استثمارية أو توصيات شخصية أو أي ضمان للأداء المستقبلي.


السعر
منذ 31/10/2024
56
المبيعات
1.75K
التثبيتات المجانية