
VegaXLR - Analysis Tools Alerts
مؤشر
2 عمليات الشراء
الإصدار 1.1، Apr 2026
Windows, Mac
4.5
التقييمات: 2
الوصف
أدوات تنبيهات تحليل cTrader هي مؤشر شامل مصمم لتعزيز تجربتك في الرسم البياني من خلال إضافة التنبيهات، التسميات، وترميز الألوان التلقائي لأدوات الرسم المختلفة.
الميزات:
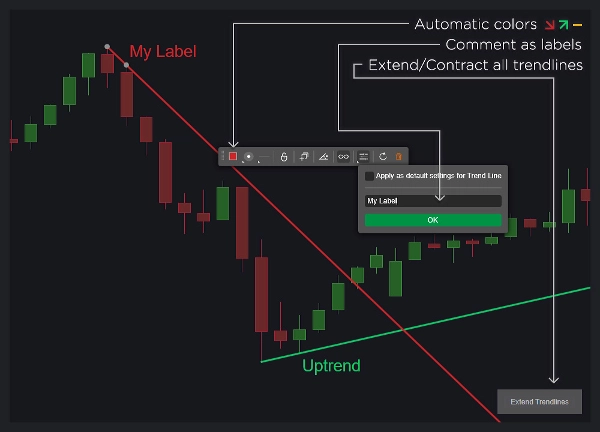
- خطوط الاتجاه:
-
- عرض تسميات مخصصة باستخدام تعليقات الكائن.
- تغييرات لونية ديناميكية بناءً على اتجاه خط الاتجاه.
- خيار لإزالة خطوط الاتجاه بعد التنبيه.
- تمكين أو تعطيل التنبيهات الخاصة بخطوط الاتجاه.
- تمديد أو تقصير جميع خطوط الاتجاه بنقرة واحدة.
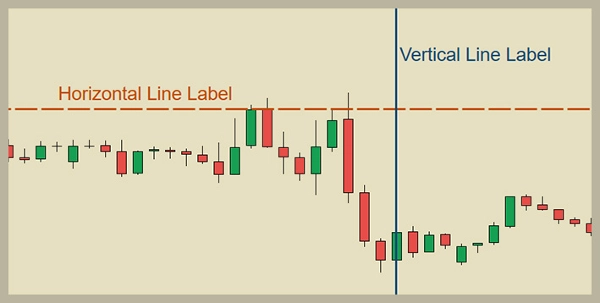
- الخطوط الأفقية والعمودية:
-
- عرض تسميات مخصصة باستخدام تعليقات الكائن.
- حذف الخطوط تلقائيًا بعد التنبيه.
- تكوين التنبيهات لكل نوع من الخطوط.
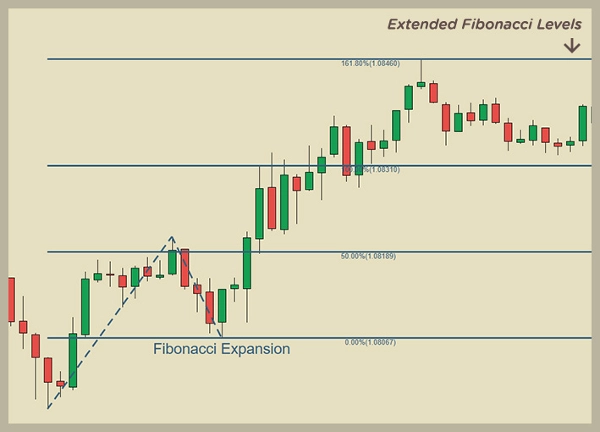
- مستويات تصحيح وتوسع فيبوناتشي:
-
- عرض تسميات مخصصة باستخدام تعليقات الكائن.
- تمديد خطوط المستوى تلقائيًا إلى ما لا نهاية.
- خيار حذف الكائنات بعد التنبيه.
- تعيين الألوان بناءً على اتجاه الرسم.
- تمكين أو تعطيل التنبيهات لمستويات فيبوناتشي.
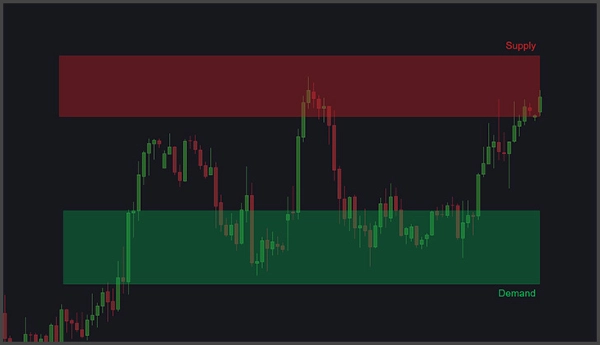
- المستطيلات (مناطق العرض والطلب):
-
- عرض تسميات مخصصة باستخدام تعليقات الكائن.
- تنبيهات لتفاعلات السعر وارتفاعات حجم التيك.
- تعيين معايير لتنبيهات ارتفاع حجم التيك، بما في ذلك أشرطة الرجوع، نسبة زيادة الحجم، وفترة التوقف بعد التنبيه.
- ملء المستطيل تلقائيًا وتمديده إلى الشمعة النشطة.
- التخصيص العام:
-
- ضبط مواضع التسميات وأحجام النص لكل نوع من الكائنات.
- تخصيص الألوان التلقائية.
- تضمين تعليقات الكائن في رسائل التنبيه.
- تمكين أو تعطيل التنبيهات لكل نوع من الكائنات.
- التنبيهات والمساعدة:
-
- تلقي التنبيهات عبر الصوت، النوافذ المنبثقة، تيليجرام، والبريد الإلكتروني.
- لقطات شاشة تلقائية للرسم البياني تُرسل إلى تيليجرام.
- دليل المستخدم متاح من خلال زر صغير على الرسم البياني.
هذه الأداة مثالية للمتداولين الذين يستخدمون الدعم والمقاومة، العرض والطلب، فيبوناتشي، أو خطوط الاتجاه في استراتيجياتهم.
الملخص
ملخص الذكاء الاصطناعي
VegaXLR - Analysis Tools Alerts is an all-in-one indicator for the cTrader platform that enhances chart analysis by integrating alerts, labels, and automatic color-coding with various drawing tools. It supports trendlines, horizontal and vertical lines, Fibonacci retracement and expansion levels, and rectangles representing supply and demand areas.
Key features include:
- Trendlines: Custom labels from object comments, dynamic color changes based on direction, options to remove or extend trendlines after alerts, and toggle alerts per trendline.
- Horizontal and Vertical Lines: Custom labels, automatic deletion after alerts, and configurable alerts per line type.
- Fibonacci Levels: Custom labels, infinite extension of level lines, color assignment by drawing direction, and alert enable/disable options.
- Rectangles (Supply and Demand): Custom labels, alerts for price interactions and tick volume spikes with adjustable parameters, automatic fill and extension to the active candle.
- Overall customization allows adjustment of label positions, text sizes, automatic colors, inclusion of comments in alerts, and enabling/disabling alerts per object type.
- Alerts can be received via sound, pop-ups, Telegram, and email, with automatic chart screenshots sent to Telegram.
- A user guide is accessible directly on the chart.
This tool is suited for traders employing support and resistance, supply and demand, Fibonacci, or trendline strategies.
ملف تعريف المؤشر
فئة المؤشر
الدعم والمقاومة
نوع المخرجات
التصور
متطلبات البيانات
أعمدة السعر فقط
الإشارات المدعومة
تقاطع
الانقطاع
لمس المستوى
كسر المستوى
الانعكاس
قوة الاتجاه
تقييمات العملاء
4.5
التقييمات: 2
5 | 50 % | |
4 | 50 % | |
3 | 0 % | |
2 | 0 % | |
1 | 0 % |
مناقشة
الأسئلة الشائعة
Fibonacci
Forex
Supply & Demand
Support & Resistance
يتم توفير المنتجات المتاحة من خلال cTrader Store، بما في ذلك روبوتات التداول والمؤشرات والإضافات، من قبل مطوري الطرف الثالث وإتاحتها لأغراض الوصول المعلوماتي والفني فقط. cTrader Store ليس وسيطًا ولا يقدم نصائح استثمارية أو توصيات شخصية أو أي ضمان للأداء المستقبلي.


السعر
228
المبيعات
685
التثبيتات المجانية