الوصف
هذا ليس مؤشر دلتا الحجم التقليدي الخاص بك. هذا هو مؤشر دلتا حجم DOM المستوى 2 — تدفق أوامر من الدرجة المؤسسية لـ cTrader. الميزة التي تدفع المؤسسات ملايين من أجلها.
المشكلة التي يواجهها كل متداول تجزئة. يغلق الشمعة باللون الأخضر. الحجم مرتفع. تشتري.
ينعكس السعر على الفور. يتم إيقافك. "كذبت" عليك المخططات.
لم تكذب — لم تستطع فقط رؤية ما كان يحدث داخل الشمعة. تلك الشمعة الخضراء ذات الحجم العالي؟ 70٪ من ذلك الحجم كان بيعًا عدوانيًا. تم دعم الإغلاق بطبقة رقيقة من أوامر الشراء في أسفل النطاق. كانت المؤسسات توزع على أمر الشراء الخاص بك.
تُظهر مؤشرات الحجم القياسية الإجمالي. لكنها لا تُظهر لك أبدًا من كان المسيطر.
دلتا الحجم تغير ذلك. ما يظهره دلتا الحجم فعليًا لك
يفصل دلتا الحجم حجم كل شريط إلى حجم الشراء و حجم البيع، ثم يحسب الفرق — وهو الدلتا. الدلتا الإيجابية تعني أن المشترين كانوا أكثر عدوانية. الدلتا السلبية تعني أن البائعين سيطروا.
هذه هي أهم معلومة تميز المتداولين المحترفين عن متداولي التجزئة: ليس كمية التداول، بل أي جانب كان يتداول بشكل أكثر عدوانية. هذا هو الإيمان. الدلتا هي بصمة النية وراء كل شريط سعري.
لكن الأمر لا يتوقف عند هذا الحد
هذا المؤشر لا يخمن. في مزيج خاص من البيانات يقرأ بيانات عمق السوق المستوى 2 — دفتر الأوامر الفعلي الموجود خلف السعر الذي تراه على الشاشة.
بيانات المستوى 2 (المعروفة أيضًا باسم DOM — عمق السوق) تظهر أوامر الشراء والبيع الحقيقية المكدسة عند كل مستوى سعري. ليست الصفقة الأخيرة. ليست تقديرًا. السيولة الراسية الفعلية من البنوك وصناديق التحوط ومكاتب المؤسسات التي تتدفق عبر مزودي السيولة لدى وسيطك.
النتيجة هي مستوى دقة يبلغ 85-95% في تصنيف حجم الشراء مقابل البيع — أبعد بكثير مما يمكن لأي تقريب معتمد على الصيغ تحقيقه.
لماذا هذا مهم — ما تراه المؤسسات ولا تراه أنت
غولدمان ساكس، سيتادل، جامب تريدينغ — جميعهم يتداولون باستخدام بيانات تدفق الأوامر. يرون ضغط الشراء والبيع في الوقت الحقيقي. يرون الامتصاص. يرون عندما يتم الدفاع عن مستوى معين. يرون عندما تنحرف الدلتا عن السعر.
يدفعون ملايين من أجل هذه البنية التحتية. تغذيات البيانات، الخوادم المشتركة، الأدوات الخاصة.
يجلب هذا المؤشر نفس المفهوم الأساسي إلى مخطط cTrader الخاص بك. ليس نسخة مخففة. بيانات DOM المستوى 2 الفعلية من تجمع السيولة لدى وسيطك، معالجة إلى نفس تصنيف الشراء مقابل البيع الذي يستخدمه متداولو تدفق الأوامر المحترفون.
الفرق بين متداول التجزئة والمتداول المؤسسي ليس الذكاء. إنه المعلومات. دلتا الحجم تسد هذه الفجوة.
لمن هذا موجه
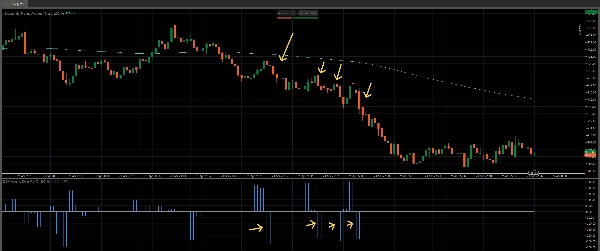
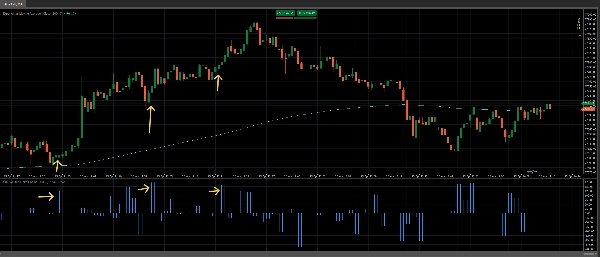
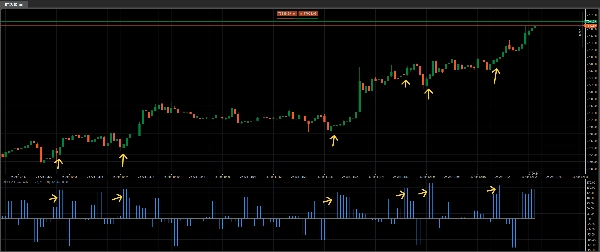
متداولو اليوم الذين يريدون رؤية ما وراء الضوضاء. عندما تبدو الشمعة صاعدة لكن الدلتا سلبية، تعرف أن تنتظر. عندما تبدو الشمعة ضعيفة لكن الدلتا إيجابية بقوة، تعرف أن المؤسسات تتراكم. الدلتا لا تكذب — تظهر ما حدث، وليس كيف بدا.
المتداولون السريعون الذين يحتاجون إلى معرفة أي جانب هو المسيطر الآن. ارتفاع مفاجئ في الدلتا عند اختراق يؤكد أنه حقيقي. اختراق مع دلتا ثابتة يخبرك أنه فخ قبل أن يبدأ الانعكاس.
متداولو التأرجح الذين يريدون التوافق. انحرافات الدلتا — حيث يصنع السعر قاعًا جديدًا لكن الدلتا ترتفع — هي من بين أكثر إشارات الانعكاس موثوقية في التداول المحترف. يكتشف هذا المؤشر ذلك تلقائيًا.
أي شخص يتداول الفوركس أو المؤشرات أو السلع على cTrader مع وسيط يوفر بيانات المستوى 2. توفر Fusion Markets و IC Markets و Go Markets وغيرها من وسطاء ECN/STP المماثلين بيانات DOM التي يقرأها هذا المؤشر.
إذا كنت قد كنت يومًا على الجانب الخطأ من شمعة "ذات حجم مرتفع"، فهذه هي الأداة التي تخبرك لماذا.
ما ستحصل عليه
مخطط بياني نظيف واحترافي أسفل مخططك يظهر صافي الدلتا لكل شريط، استنادًا إلى بيانات دقيقة للغاية. الأشرطة الإيجابية تعني سيطرة المشترين. الأشرطة السلبية تعني سيطرة البائعين. حجم الشريط يظهر لك كمية تفوق جانب على الآخر. استخدامه مع مؤشرات مثل 200 ema يعطي توافقًا وإعدادات ذات احتمالية عالية.
لا فوضى. لا متوسطات متحركة متأخرة للحجم. لا شموع ملونة "تقدر" الشراء والبيع. فقط الفرق الخام وغير المصفى بين الشراء العدواني والبيع العدواني — محسوب من أعمق مصدر بيانات متاح لمتداولي التجزئة.
يوفر هذا المؤشر أيضًا خيار استخدام فلتر حجم لعرض الأشرطة التي تهم فقط. تجميع أشرطة الحجم إذا رغبت.
نظرة واحدة على شريط الدلتا تخبرك بما تحاول عشرة مؤشرات أخرى تقريبه. احصل على نسختك الآن لـ cTrader. هذا قرار سهل لهذا السعر المنخفض.
اجمع هذا مع مؤشر Volume Profile Pro الخاص بنا لقرارات أكثر اطلاعًا عند المستويات الرئيسية: https://ctrader.com/products/4079
شاهد روبوت Black Box المذهل لدينا هنا: https://ctrader.com/products/3241
الملخص
The indicator displays a clean histogram below the chart representing net volume delta per bar: positive bars indicate buyer dominance, negative bars indicate seller dominance, and bar size reflects the strength of that dominance. This provides traders with insight into market intent beyond total volume, revealing whether buyers or sellers controlled the price action.
It supports forex, indices, and commodities trading with brokers offering Level 2 data, such as Fusion Markets and IC Markets. Features include volume filtering and aggregated volume bars. The tool is suited for day traders, scalpers, and swing traders seeking to interpret order flow, confirm breakouts, detect divergences, and enhance decision-making with professional-level order flow data.
تقييمات العملاء
5 | 50 % | |
4 | 50 % | |
3 | 0 % | |
2 | 0 % | |
1 | 0 % |