

الوصف
أولئك الذين يشاركون في التداول يعرفون مدى أهمية أخذ الجلسة السابقة في الاعتبار.
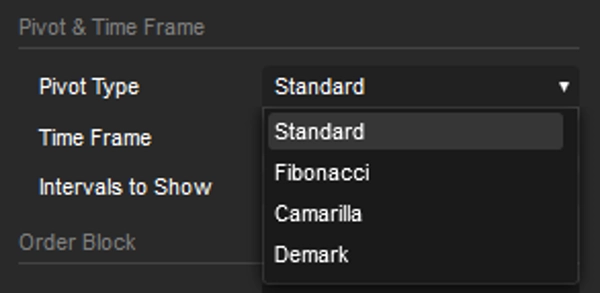
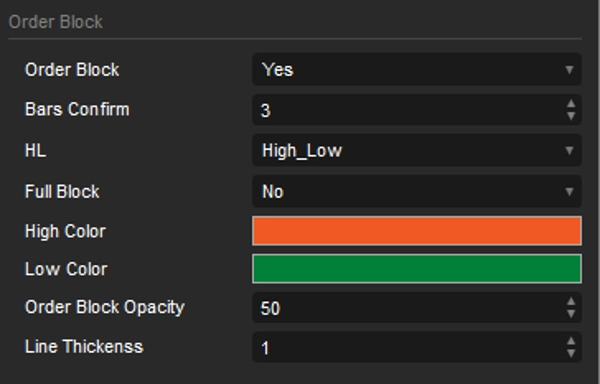
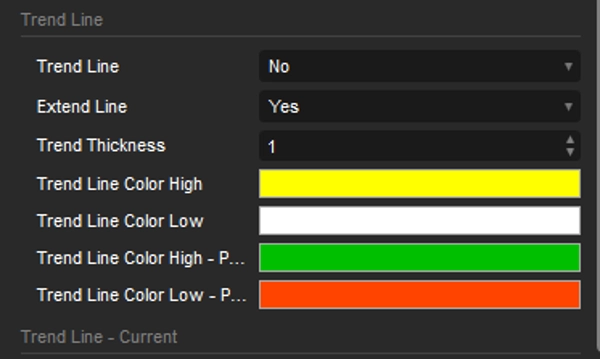
لقد أعددت هذا المؤشر المحوري، بفترات زمنية من 15 دقيقة حتى شهر، ويشمل كتل الأوامر وخطوط الاتجاه. كلا الخيارين يستندان إلى أعلى وأدنى نقاط الجلسة السابقة.
الإعداد الافتراضي مضبوط على إطار زمني مدته 5 دقائق.
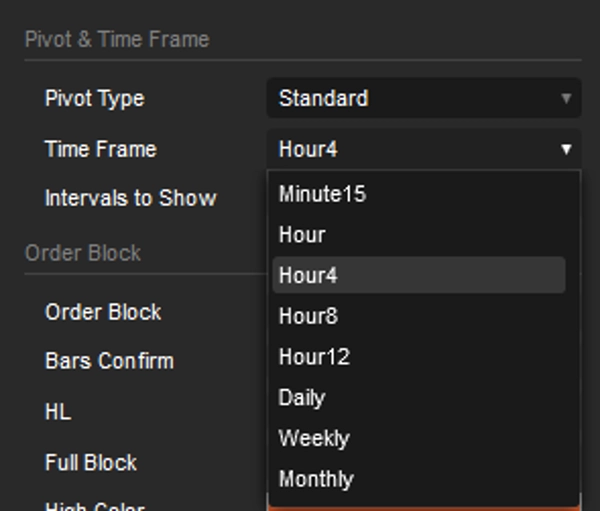
المحور مضبوط على 4 ساعات، والفاصل الزمني هو 5، مما يعني أنه ينظر إلى الوراء 20 ساعة بفواصل 4 ساعات. هذا مثالي لأولئك الذين يتداولون يوميًا.
ومع ذلك، إذا كنت من محبي التداول المتأرجح، كل ما عليك هو تغيير فاصل المحور؛ كل شيء آخر يتكيف تلقائيًا.
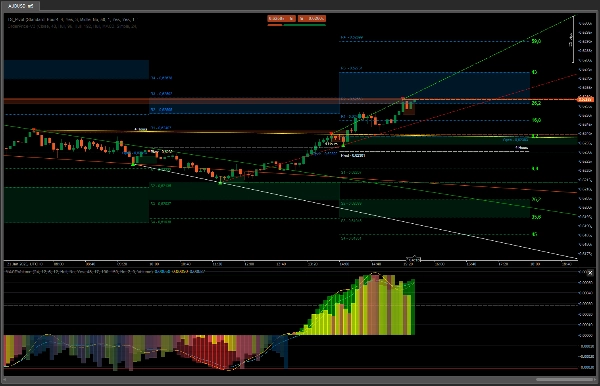
تسلط كتل الأوامر الضوء على المناطق المحتملة التي قد يجد فيها السعر دعمًا أو مقاومة، مما يوفر رؤية حول الانعكاسات أو الاستمراريات المحتملة. من خلال دمجها مع خطوط الاتجاه التي يتم إنشاؤها تلقائيًا للإطار الزمني المختار، يمكن للمتداولين تحديد اتجاه السعر المحتمل ونقاط الدخول أو الخروج المحتملة بدقة أكبر. القدرة على تصور هذه الخطوط عبر أطر زمنية متعددة توفر فهمًا أكثر شمولاً لبنية السوق.
مع أدوات إضافية مثل
OrderPrice V3 https://ctrader.com/products/397
NTMPICLL https://ctrader.com/products/327
Range Box Level https://ctrader.com/products/245
Or RangeBoxFibonacci https://ctrader.com/products/526
Market Session https://ctrader.com/products/94
MacdVolume https://ctrader.com/products/267
4MA https://ctrader.com/products/247
ستكون لا تقهر
حظًا سعيدًا 😀
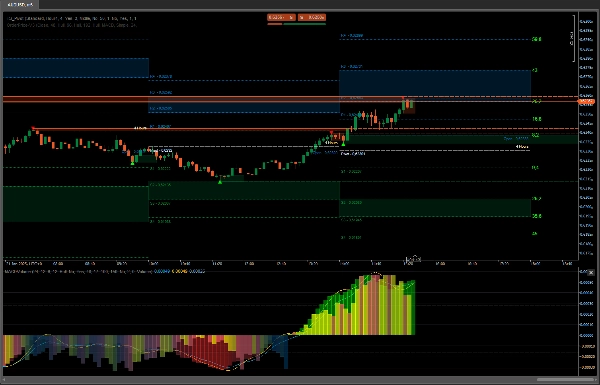
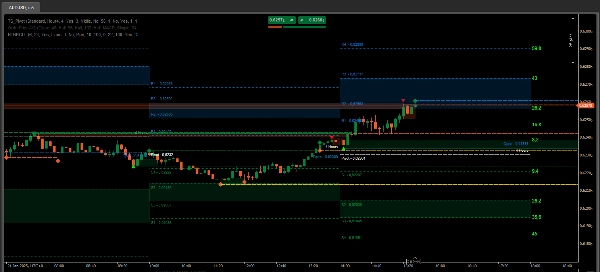
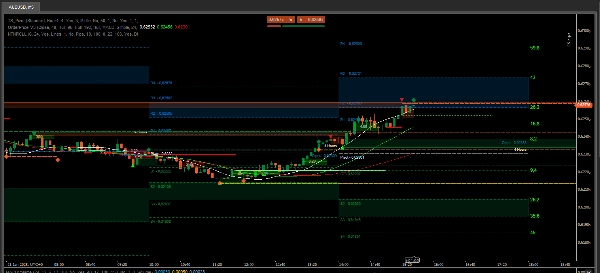
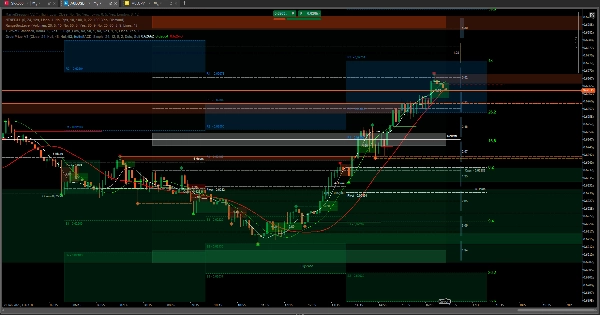
في حالة الشراء، عند ملاحظة السلوك في الصورتين الأخيرتين لـ OrderPrice والمتوسطات المتحركة المدمجة، عندما تظهر خط أخضر ويكون المتوسط المتحرك أدناه، فهذا هو الوقت المثالي لفتح صفقة شراء.
مع بيانات الجلسة السابقة، يمكنك تحديد مدى احتمال تحرك السعر أو مكان حدوث المقاومة. إذا اخترق، فقد يستمر إلى النقطة الثانية، والتي قد تكون المنطقة المحايدة لـ RangeBoxLevel. إذا تجاوز ذلك ولم تكن هناك علامات على أن المتوسطات المتحركة تريد تغيير الاتجاه، فقد يصل السعر إلى منطقة كتلة الأوامر للجلسة السابقة.
في الصورة الأخيرة، هناك لقطة شاشة لحالة مثالية للدخول والخروج من صفقة. الباقي هو مجرد المراقبة واستخلاص الاستنتاجات.
هذه الأدوات ضرورية عندما يتعلق الأمر بالفوز من خلال تداول الأصول.
الملخص
Key features include the integration of order blocks and trend lines derived from previous session data. Order blocks identify potential support and resistance zones, aiding in spotting possible price reversals or continuations. The indicator automatically generates trend lines for the selected timeframe, helping traders assess market structure and potential price direction. Visualizing these trend lines across multiple timeframes enhances market analysis.
TS_Pivot can be used alongside complementary tools such as OrderPrice V3, NTMPICLL, Range Box Level, RangeBoxFibonacci, Market Session, MacdVolume, and 4MA to refine entry and exit decisions. By combining moving averages and order block signals, traders can identify optimal moments to open buy or sell positions. The indicator supports various markets including Forex, cryptocurrencies, commodities, indices, and stocks.
تقييمات العملاء
5 | 100 % | |
4 | 0 % | |
3 | 0 % | |
2 | 0 % | |
1 | 0 % |


