
Deskripsi
Indikator analisis teknikal ini memberikan informasi tentang sentimen pasar, tren, dan level harga. Ini menggunakan data seperti Volume, Open_Close, Chaikin Volatility, dan Chaikin Money Flow untuk menghitung sentimen pasar. Ini juga memungkinkan Anda untuk menyesuaikan spread, mendeteksi tren, dan memvisualisasikan level harga dan pip. Ini adalah alat yang berguna untuk mengidentifikasi kekuatan yang dominan di pasar, mengantisipasi pergerakan harga, dan meningkatkan pengambilan keputusan perdagangan.
Dalam deskripsi, saya menunjukkan parameter penting; sisanya adalah konfigurasi gaya seperti warna, jenis garis, dan ukuran font.
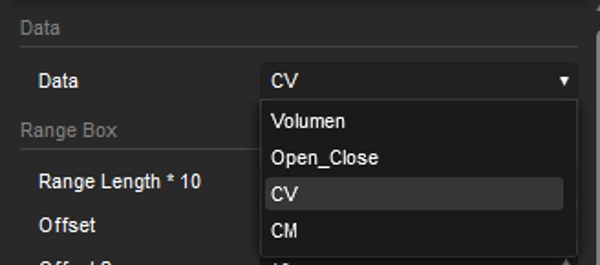
Data
Perhitungan sentimen didasarkan pada pemilihan dari Volume, Open_Close, Chaikin Volatility, dan Chaikin Money Flow.
Panjang Rentang * 10
Nilai ini menunjukkan jumlah candle (periode) yang menjadi dasar perhitungan – nilai ini dikalikan dengan 10.
Tambah Zoom
Untuk menjaga grafik tetap terpusat, ini juga membantu mempertimbangkan situasi seperti konsolidasi dan perubahan tren.
Margin
Memungkinkan penyesuaian margin atas dan bawah untuk meningkatkan visualisasi.
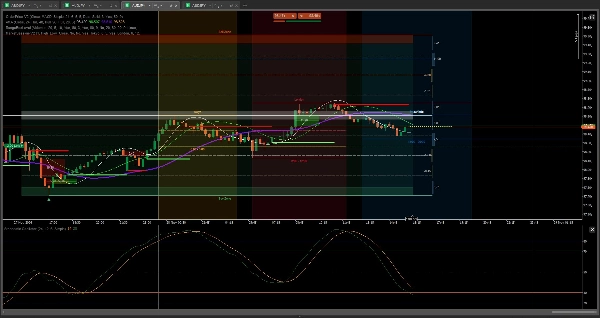
Tampilkan Sentimen
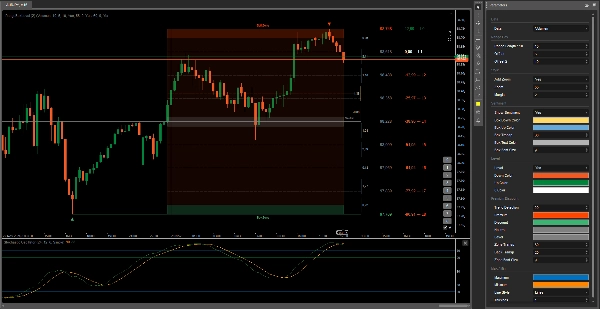
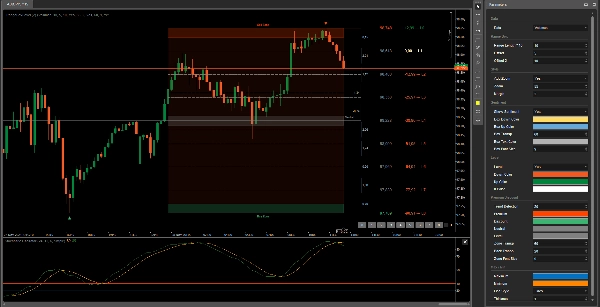
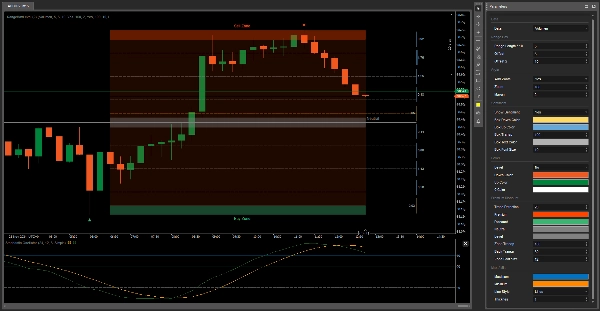
Sentimen menunjukkan kekuatan mana yang lebih dominan di pasar saat ini. Jika batang kuning bertambah besar, itu berarti ada lebih banyak penjual, dan sebaliknya. Jika Anda tidak ingin melihat visualisasi sentimen, Anda dapat menyembunyikannya di sisi kanan.
Level
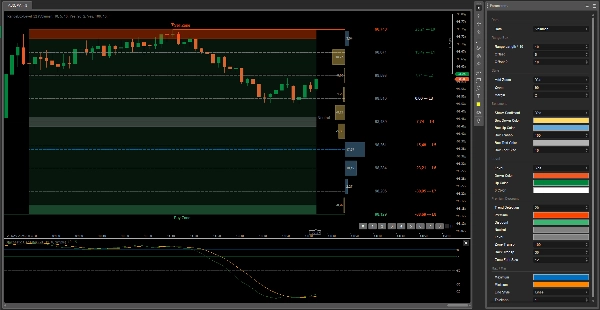
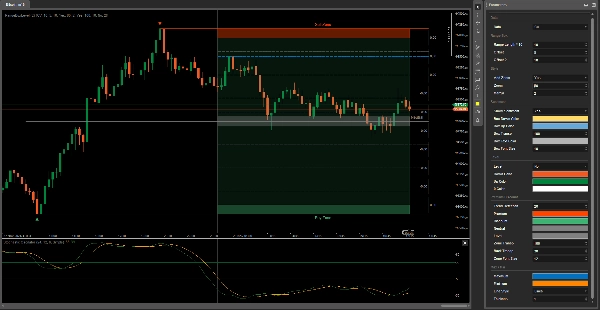
Ini adalah fitur tambahan yang dapat digunakan sebagai referensi untuk harga dan pip pada setiap level. Ketika Anda memilih level di mana Anda ingin menempatkan order beli, ini menunjukkan pip pada setiap level yang dapat dicapai harga.
Deteksi Tren
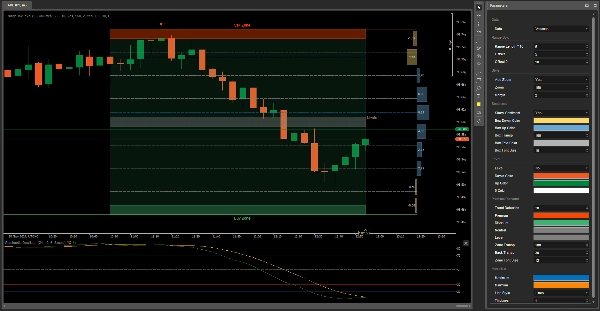
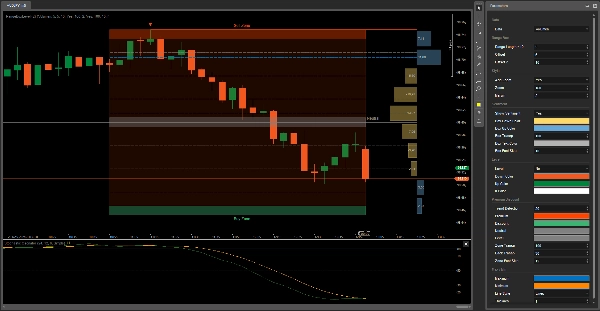
Bergantung pada tren aset, latar belakang Range Box berubah: hijau jika bullish dan merah jika bearish.
Maks / Min
Ini adalah garis biru dan kuning yang mengubah posisinya sesuai dengan prediksi ke mana harga mungkin bergerak. Range Box dibagi menjadi 9 bagian untuk membantu menentukan titik infleksi harga, berfungsi sebagai Fibonacci Retracement.
Anda akan menjadi tak terkalahkan
Semoga berhasil 😀
Ringkasan
Key features include sentiment visualization with bars indicating the dominance of buyers or sellers, trend detection through background color changes (green for bullish, red for bearish), and level indicators that display potential price and pip targets for placing orders. The Range Box is divided into nine sections to identify price inflection points, functioning similarly to Fibonacci retracement levels, with dynamic max/min lines predicting possible price movements.
This tool supports analysis across various markets including stocks, cryptocurrencies, indices like NAS100, and commodities such as XAUUSD (gold). It is suitable for trading strategies like scalping and grid trading and can assist traders in anticipating price movements and making informed decisions. The indicator integrates with additional tools for enhanced order price management and market session analysis.
Ulasan pelanggan
5 | 100 % | |
4 | 0 % | |
3 | 0 % | |
2 | 0 % | |
1 | 0 % |


