present
Sign up and get $50 off your first purchase

Description

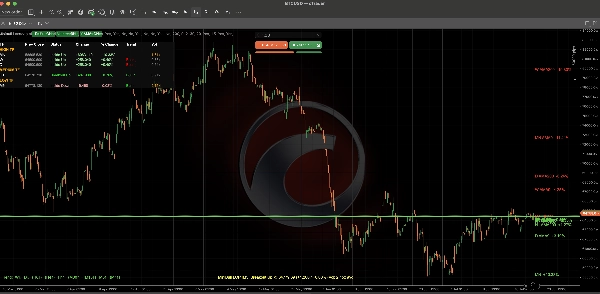
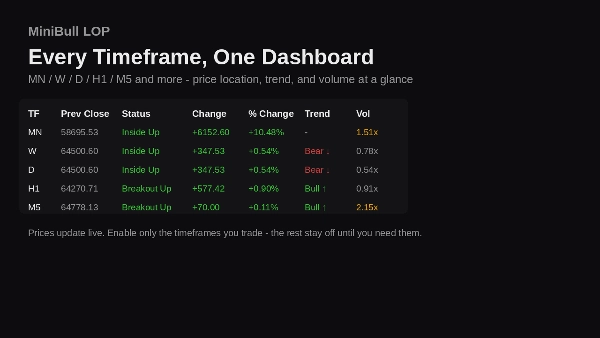
MiniBull Location of the Price (LOP) shows exactly where price sits vs the last closed bar across every timeframe that matters: Monthly, Weekly, Daily, H8, H4, H1, M30, M15, M5, M1 (configurable; five active by default).

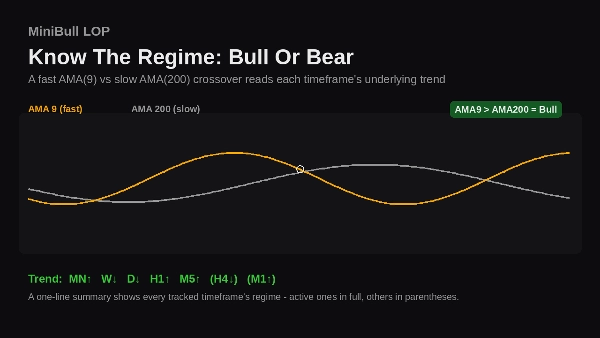
For each timeframe: previous close, absolute and % change, a Bull/Bear trend read from a dual AMA (9/200) crossover, and a tick-volume ratio vs its own average, in one on-chart dashboard toggled with a click.

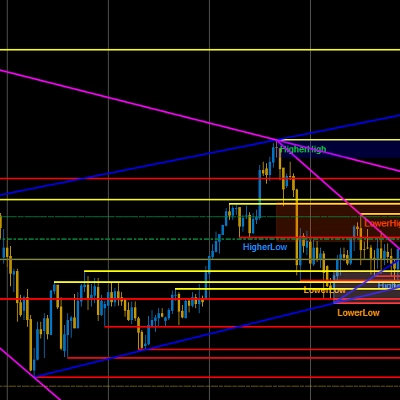
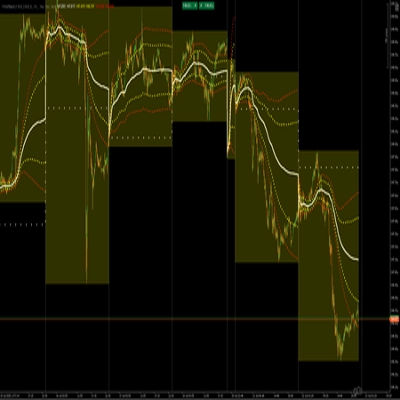
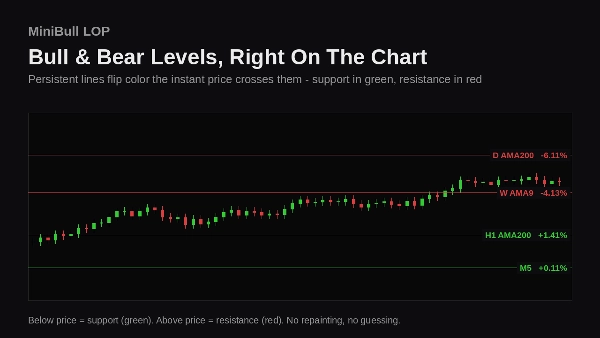
Persistent, color-coded lines (green = support, red = resistance) mark every level on the chart and update live, so you always know where price stands without opening a sub-window.

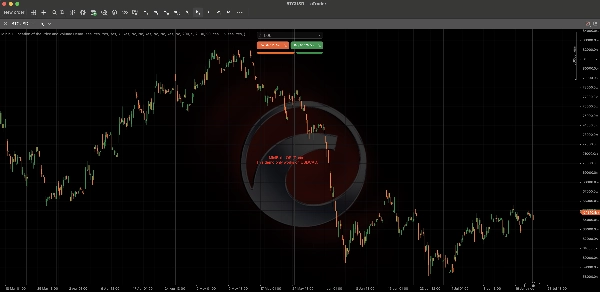
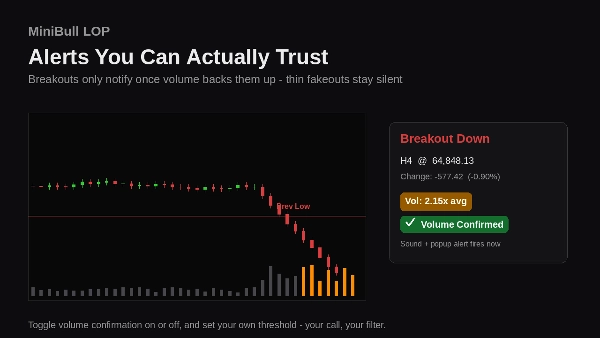
Breakout alerts (sound + popup) fire when price clears a prior high or low, optionally requiring volume confirmation, filtering out thin, low-conviction fakeouts.

A compact trend summary at the chart's bottom gives a one-line market-mood read across every tracked timeframe, active or not.

Built for traders who think across timeframes: spot alignment, spot divergence, never lose track of price vs yesterday, last week, or last month.

Summary

AI summary
Minibull Location of the Price and Volume is a multi-timeframe trading indicator designed to display the current price position relative to the last closed bar across key timeframes including Monthly, Weekly, Daily, and intraday intervals (H8, H4, H1, M30, M15, M5, M1). It provides a compact on-chart dashboard showing previous close, absolute and percentage price changes, a Bull/Bear trend signal derived from a dual Adaptive Moving Average (AMA) crossover (periods 9 and 200), and a tick-volume ratio compared to its average. The indicator features persistent, color-coded support (green) and resistance (red) lines that update live on the chart, enabling quick visual identification of key levels without opening additional windows. Breakout alerts with sound and popup notifications trigger when price surpasses prior highs or lows, with optional volume confirmation to reduce false signals. A concise trend summary at the chart’s bottom offers a one-line market mood overview across all tracked timeframes. This tool is intended for traders analyzing price and volume alignment or divergence across multiple timeframes to maintain situational awareness of price relative to recent closes.
Indicator profile
Indicator category
Trend
Output type
Visualisation
Signals
Data requirements
Bars only
Volume
Supported signals
Cross
Breakout
Level break

Discussion

Customer reviews

0.0
Reviews: 0
Customer reviews
No reviews for this product yet. Already tried it? Be the first to tell others!

FAQ

SMA
Key Levels
Volume
Moving Average
Support & Resistance
Products available through cTrader Store, including trading bots, indicators and plugins, are provided by third-party developers and made available for informational and technical access purposes only. cTrader Store is not a broker and does not provide investment advice, personal recommendations or any guarantee of future performance.

Price