
Description
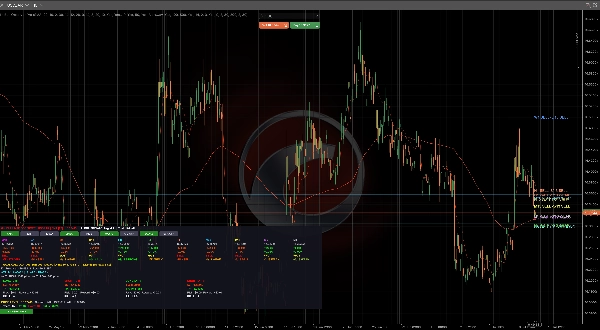
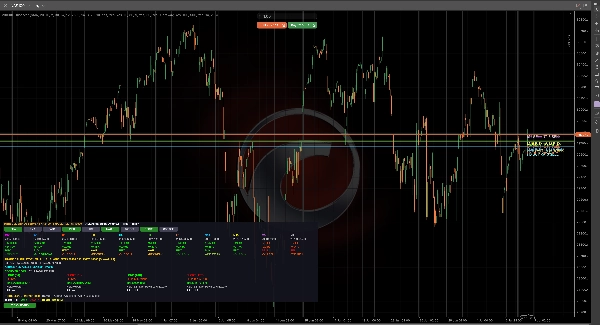
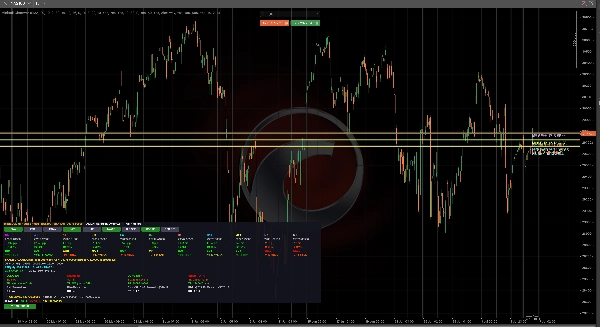
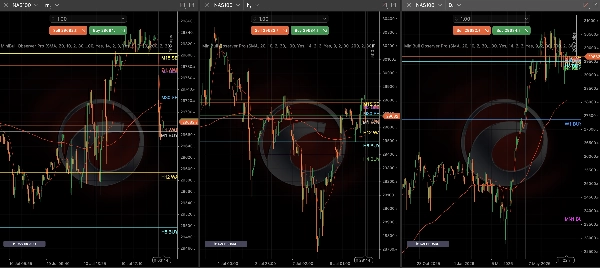
MiniBull Observer is a multi-timeframe market bias dashboard for cTrader, blending Moving Averages, RSI, MACD, Stochastic, CCI, and Momentum into one composite score across 11 timeframes. See instantly whether the market is aligned bullish, bearish, or mixed, with color-coded per-timeframe signals and an overall alignment summary. The built-in Trade Calculator estimates SL/TP and risk/reward using Wilder's ATR, covering both breakout scenarios around the previous daily high/low and standard ATR-based entries. A Price Level Analysis module tracks all-time highs/lows, level tests, and breakout bias over a configurable lookback. Choose SMA, EMA, or KAMA for the core moving average, toggle MA lines and signals on the chart, and customize colors, fonts, and panel position. Optional D1 level alerts with sound notifications keep you informed of key breakouts and approaches. Lightweight and self-contained, requiring no file or network access, so it runs cleanly on both desktop and cloud-hosted cTrader instances.
Summary
Key features include a built-in Trade Calculator that estimates stop loss, take profit, and risk/reward ratios based on Wilder's ATR, supporting both breakout and ATR-based entry scenarios. The Price Level Analysis module monitors all-time highs/lows, level tests, and breakout bias over a configurable lookback period. Users can customize moving average types, toggle MA lines and signals on the chart, and adjust colors, fonts, and panel positioning.
Optional daily-level alerts with sound notifications inform users of key breakout events. The indicator is lightweight, self-contained, and operates without file or network dependencies, ensuring smooth performance on both desktop and cloud-hosted cTrader environments. It supports visualization, signal generation (cross, reversal, level touch, level break), and filtering based on bar data.
Customer reviews
5 | 100 % | |
4 | 0 % | |
3 | 0 % | |
2 | 0 % | |
1 | 0 % |