present
Sign up and get $50 off your first purchase
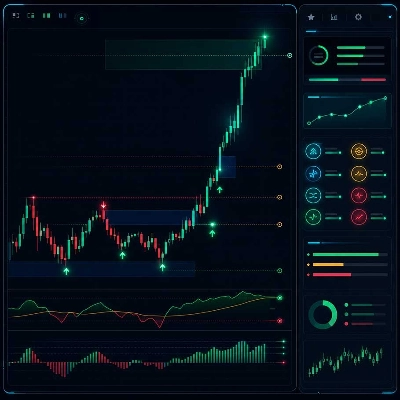
Trading product for Minibull Location of the Price and Volume Indicator SMA Key Levels, image 1
Minibull Location of the Price and Volume
Indicator
Version 1.0, Jul 2026
Windows, Mac
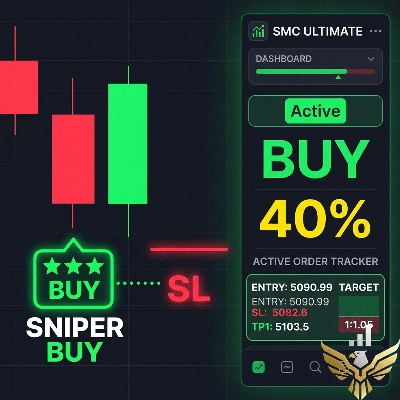
Trading product for Minibull Location of the Price and Volume Indicator SMA Key Levels, image 2
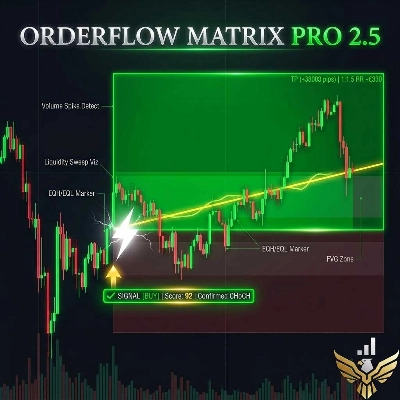
Trading product for Minibull Location of the Price and Volume Indicator SMA Key Levels, image 3
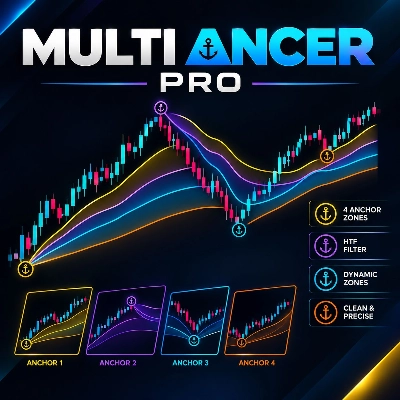
Trading product for Minibull Location of the Price and Volume Indicator SMA Key Levels, image 4
Trading product for Minibull Location of the Price and Volume Indicator SMA Key Levels, image 5
Trading product for Minibull Location of the Price and Volume Indicator SMA Key Levels, image 6
Trading product for Minibull Location of the Price and Volume Indicator SMA Key Levels, image 7

Description

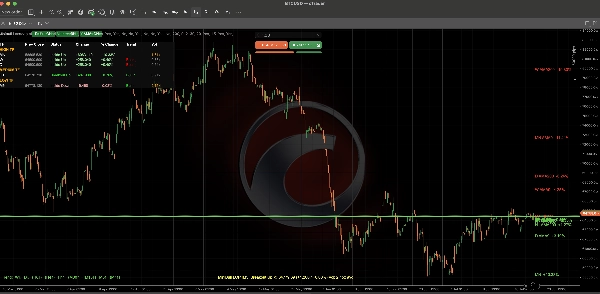
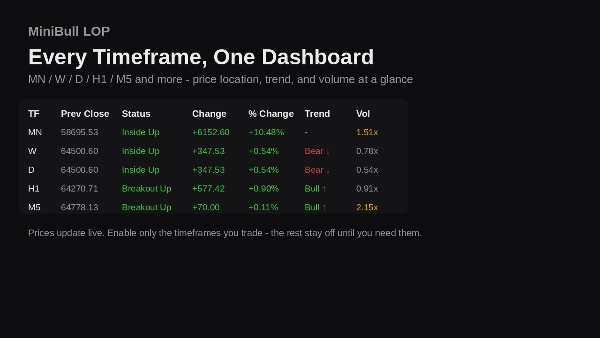
MiniBull Location of the Price (LOP) shows exactly where price sits vs the last closed bar across every timeframe that matters: Monthly, Weekly, Daily, H8, H4, H1, M30, M15, M5, M1 (configurable; five active by default).

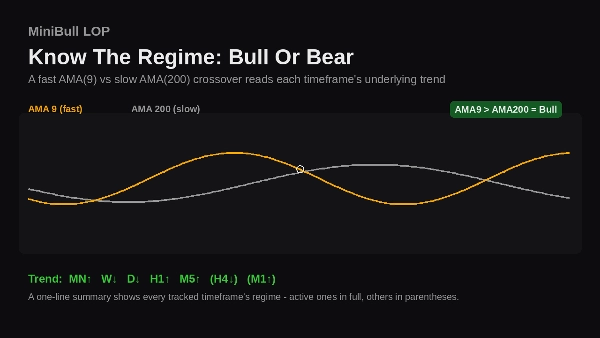
For each timeframe: previous close, absolute and % change, a Bull/Bear trend read from a dual AMA (9/200) crossover, and a tick-volume ratio vs its own average, in one on-chart dashboard toggled with a click.

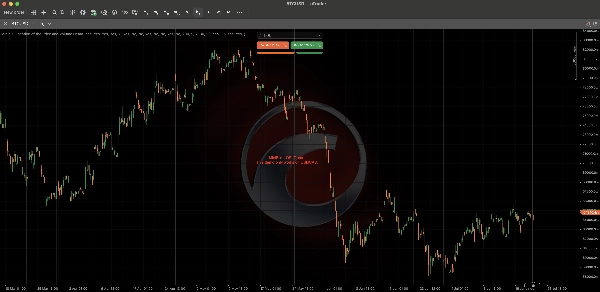
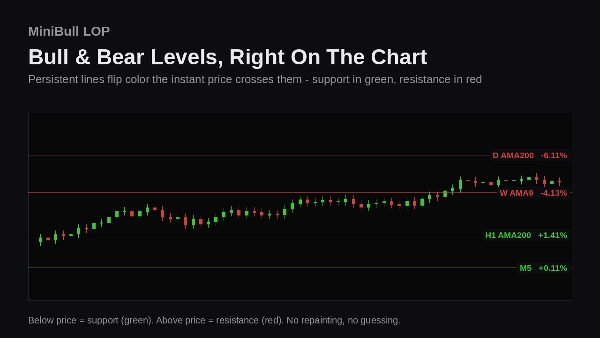
Persistent, color-coded lines (green = support, red = resistance) mark every level on the chart and update live, so you always know where price stands without opening a sub-window.

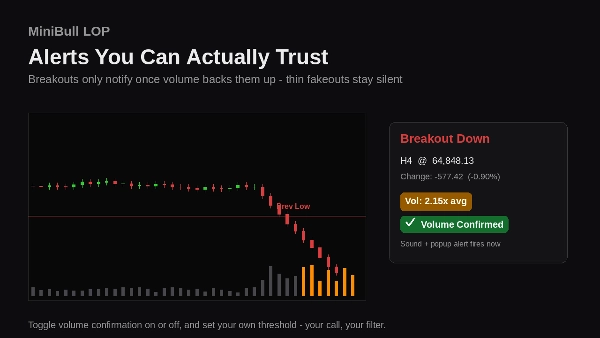
Breakout alerts (sound + popup) fire when price clears a prior high or low, optionally requiring volume confirmation, filtering out thin, low-conviction fakeouts.

A compact trend summary at the chart's bottom gives a one-line market-mood read across every tracked timeframe, active or not.

Built for traders who think across timeframes: spot alignment, spot divergence, never lose track of price vs yesterday, last week, or last month.


Summary

AI summary
Minibull Location of the Price and Volume is a multi-timeframe trading indicator designed to display the current price position relative to the last closed bar across key timeframes including Monthly, Weekly, Daily, and intraday intervals (H8, H4, H1, M30, M15, M5, M1). It provides a compact on-chart dashboard showing previous close, absolute and percentage price changes, a Bull/Bear trend signal derived from a dual Adaptive Moving Average (AMA) crossover (periods 9 and 200), and a tick-volume ratio compared to its average. The indicator features persistent, color-coded support (green) and resistance (red) lines that update live on the chart, enabling quick visual identification of key levels without opening additional windows. Breakout alerts with sound and popup notifications trigger when price surpasses prior highs or lows, with optional volume confirmation to reduce false signals. A concise trend summary at the chart’s bottom offers a one-line market mood overview across all tracked timeframes. This tool is intended for traders analyzing price and volume alignment or divergence across multiple timeframes to maintain situational awareness of price relative to recent closes.
Indicator profile
Indicator category
Trend
Output type
Visualisation
Signals
Data requirements
Bars only
Volume
Supported signals
Cross
Breakout
Level break

Customer reviews

0.0
Reviews: 0
Customer reviews
No reviews for this product yet. Already tried it? Be the first to tell others!

Discussion

FAQ

SMA
Key Levels
Volume
Moving Average
Support & Resistance
Products available through cTrader Store, including trading bots, indicators and plugins, are provided by third-party developers and made available for informational and technical access purposes only. cTrader Store is not a broker and does not provide investment advice, personal recommendations or any guarantee of future performance.

More from this author

Indicator
CCI
EMA
+5
Streamline your focus. Stop juggling multiple timeframes and view them all on a single char
Indicator
EMA
Moving Average
+2
Trade the Trend. Ignore the Noise
cBot
Fixed Lot
SL Manager
+5
Minibull AMA Sniper Pro: Filter the noise, secure the trend. Precision entries backed by bulletproof risk management.
1.17
Profit factor
Indicator
ATR
EMA
+3
Trend is your friend. Be Logical
cBot
Channel
Conservative
+3
Trade With the Trend.Enter With Precision.Multi-timeframe logic filters the noise and captures high-probability reversal
1.46
Profit factor
Indicator
SMA
Channel
+2
MiniBull Gold vs Indices is a non-repainting Balance-of-Powers indicator that tracks GOLD against three major indices.
cBot
ATR
Break Even
+4
Four markets, one divergence, one signal. Trade the reversal, manage the risk automatically
1.34
Profit factor

You may also like

Indicator
ATR
RSI
+5
One of the best indicators we have ever developed, with a very high profit ratio.
Indicator
AI
ATR
+26
The Triple Momentum indicator for cTrader is a versatile trend-following tool.
Indicator
SMC
BTCUSD
+5
SMC ICT Control Panel The all-in-one Smart Money command center for cTrader. One indicator. Every SMC/ICT tool. Zero clu
Indicator
AI
ATR
+27
Imperium MTF Heatmap is a unique top-tier indicator for cTrader, created for traders who want more than signals
Indicator
Prop
Forex
+1
Smart support/resistance indicator with rejection-only Buy/Sell signals designed for H1 charts.
Indicator
MSS
VWAP
+5
VWAP mean-reversion signals combined with a ribbon-anchored volume profile, VAH/VAL, POC and HVN levels.
Indicator
Forex
Crypto
+4
Auto-detect support and resistance & trendlines, highlight pullbacks/BOS retests, and filter with candle confirmation.
Indicator
ATR
BOS
+5
Apex Strike: Multi-timeframe (M5-H1) non-repainting indicator with winrate dashboard & alerts (Gold, BTC).
Indicator
Forex
Crypto
+4
This indicator has an in built strategy analyzer that analyze the markets and generates quality signals.
Indicator
Prop
Forex
+15
Footprint volume indicator showing bid/ask splits at each price level
Indicator
ATR
EMA
+5
Multi-factor volatility squeeze detector, dual-trend scoring & breakout validation dashboard. No repaint.
Indicator
ATR
RSI
+2
This indicator works best as a trend-confirmation tool—wait for multiple signals!
Indicator
Liquidity Grab
Liquidity Sweep
+2
Visualizes accumulation ranges, manipulation sweeps and distribution phases on your cTrader chart.
Indicator
BOS
Fibonacci
+4
Market structure, liquidity sweeps, BOS/CHoCH, smart zones and BUY/SELL setups with Entry, SL and TP.
Indicator
EMA
Channel
+3
Real-time squeeze detection, dual-horizon trend scoring & institutional breakout validation HUD dashboard.
Indicator
AI
ATR
+15
AI-powered Smart indicator. Dual neural networks self-train on live trades. Liquidity sweep + SMC. All pairs/timeframe.
Indicator
ATR
SMC
+5
CISD Projections with MTF panel: detects market shifts, auto targets, and clear real-time buy/sell signals.
Indicator
Key Levels
Supertrend
+1
A cTrader indicator for clear trend direction, entry timing, and on-chart risk visualization.

Price