คำอธิบาย
FOOTPRINT PRO — BID x ASK CLUSTER CHART
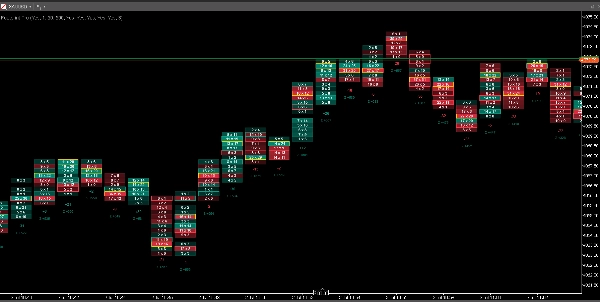
แท่งเทียนบอกคุณว่าราคาขยับไปที่ไหน Footprint บอกคุณว่าใครเป็นคนขยับมัน Footprint Pro แยกแท่งเทียนทุกแท่งออกเป็นกลุ่มราคาที่สร้างจากข้อมูลทิกจริง แสดงให้เห็นอย่างชัดเจนว่าผู้ซื้อและผู้ขายต่อสู้กันที่ไหน — และใครเป็นผู้ชนะ
นี่คือการวิเคราะห์โฟลว์คำสั่งที่ปกติจะต้องใช้แพลตฟอร์มเฉพาะและการสมัครสมาชิกแบบรายเดือน Footprint Pro นำมันมาไว้ใน cTrader โดยตรง ด้วยการซื้อครั้งเดียว
🆕 ใหม่ในเวอร์ชัน 2
• กลุ่มฮิสโตแกรม — ทุกแถวตอนนี้ถูกวาดเป็นแท่งที่ความยาวแสดงปริมาณการซื้อขาย ดังนั้นแถวที่คึกคักที่สุดจึงโดดเด่นโดยไม่ต้องถอดรหัสเฉดสี เลือกสีเด่นเดียว สีแบ่งซื้อ/ขาย หรือเก็บแผนที่ความร้อนต้นฉบับ
• ขอบแถวในสีที่คุณเลือก ตั้งค่าเป็นพื้นหลังแผนภูมิของคุณและแถวจะแยกออกเป็นแท่งที่ชัดเจนและเว้นระยะอย่างสม่ำเสมอ
• ความไม่สมดุลที่สะอาดขึ้น — เครื่องหมายตอนนี้อยู่ในขอบด้านข้างของแถวแทนที่จะล้อมรอบ มีสวิตช์เปิด/ปิด ตัวกรองขนาดขั้นต่ำเพื่อทำเครื่องหมายเฉพาะแถวที่มีน้ำหนัก และเฉดสีที่ไม่ผสมกับแท่งข้างเคียง
• ความกว้างกลุ่มที่สม่ำเสมอ — ช่องว่างของเซสชันก่อนหน้านี้อาจทำให้กลุ่มหนึ่งกว้างพอที่จะทับซ้อนกับเพื่อนบ้าน ตอนนี้แท่งเทียนทุกแท่งมีความกว้างเท่ากัน
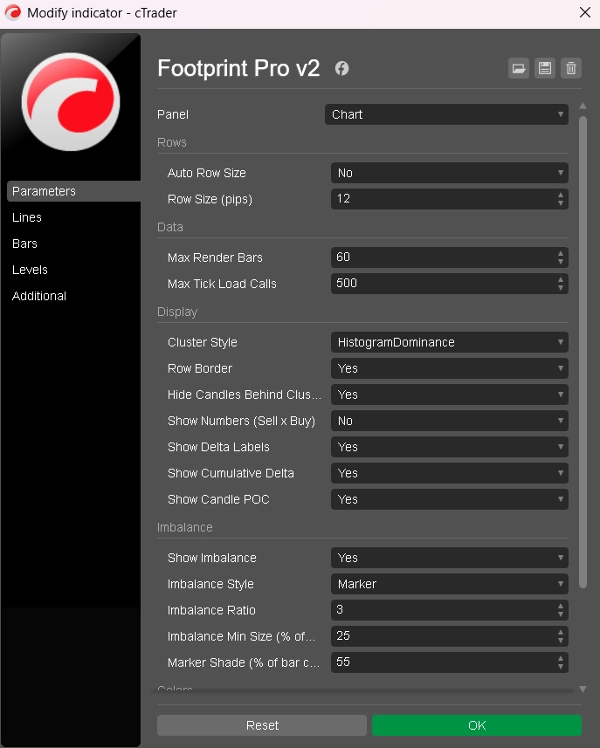
• ค่าเริ่มต้นใหม่สำหรับการดูครั้งแรกที่สะอาดขึ้น: แถวขนาดคงที่ 10 pip, สไตล์โดมิแนนซ์, ปิดตัวเลข การตั้งค่าปัจจุบันของคุณไม่ถูกแตะต้อง
🔍 สิ่งที่คุณเห็นในทุกแท่งเทียน
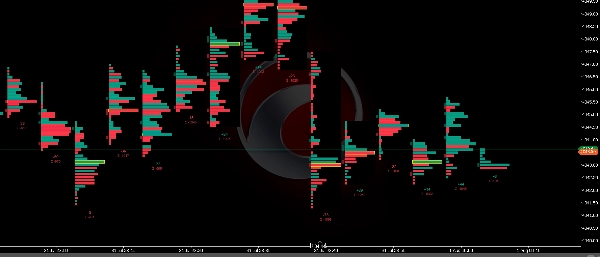
• กลุ่มปริมาณ — แท่งเทียนแต่ละแท่งถูกแบ่งเป็นแถวราคา และทุกแถวถูกวาดเป็นแท่งที่ความยาวแสดงปริมาณการซื้อขาย แถวที่คึกคักที่สุดเห็นได้ชัดเจนโดยไม่ต้องถอดรหัสสี
• สไตล์กลุ่มสามแบบ — โดมิแนนซ์ (สีเดียวต่อแถว อ่านง่ายที่สุด), แบ่งซื้อ/ขาย (แต่ละแท่งแบ่งเป็นปริมาณขายและซื้อ), หรือแผนที่ความร้อน (ความกว้างเต็ม ความเข้มตามกิจกรรม)
• ตัวเลขขาย x ซื้อ — ซูมเข้าและทุกแถวจะแสดงจำนวนทิกขายและซื้อที่แม่นยำ จำแนกโดยการเคลื่อนไหว uptick/downtick จริง
• POC ของแท่งเทียน — แถวราคาที่คึกคักที่สุดของแต่ละแท่งเทียน ขีดเส้นรอบด้วยสีทอง
• เดลต้า — การซื้อสุทธิต่อการขายต่อแท่งเทียน พิมพ์ใต้แท่งแต่ละแท่ง
• เดลต้าสะสม — เดลต้าระหว่างเซสชัน (Σ) ใต้แท่งเทียนทุกแท่ง รีเซ็ตทุกวัน สังเกตความแตกต่าง: ราคาทำจุดสูงสุดในขณะที่ Σ ลดลง เป็นสัญญาณเตือนที่แผนภูมิแท่งเทียนธรรมดาไม่สามารถให้ได้
• เครื่องหมายความไม่สมดุล — เมื่อความก้าวร้าวครอบงำฝั่งตรงข้ามแบบทแยงมุม เครื่องหมายจะปรากฏในขอบด้านข้างของแถว เครื่องหมายอยู่ข้างนอกแท่งในคอลัมน์ของตัวเอง ดังนั้นกลุ่มจึงสะอาด และเครื่องหมายที่ซ้อนกันง่ายต่อการสังเกต — มักบ่งชี้กิจกรรมสถาบัน
⚡ สร้างจากข้อมูลทิกจริง
• ทุกกลุ่มสร้างจากประวัติทิกจริงของโบรกเกอร์คุณ — ไม่ใช่การประมาณแท่ง
• การโหลดแบบขี้เกียจอัจฉริยะ: ประมวลผลเฉพาะแท่งเทียนที่มองเห็นได้ในพื้นหลัง ดังนั้นแผนภูมิของคุณจะไม่ค้าง
• อัปเดตสด: กลุ่มเดลต้าและ Σ ของแท่งเทียนปัจจุบันอัปเดตทีละทิกขณะที่การซื้อขายเกิดขึ้น
• ประวัติลึก: เมื่อคุณเลื่อนเกินข้อมูลทิกของโบรกเกอร์ Footprint Pro จะสลับไปใช้การประมาณแบบ M1 โดยอัตโนมัติและทำเครื่องหมายแท่งเหล่านั้นด้วย ≈ — ไม่มีแผนภูมิว่างเปล่า ไม่มีความประหลาดใจ
🎯 วิธีที่เทรดเดอร์ใช้
• ยืนยันการเบรกเอาท์: เดลต้าที่แข็งแกร่งและความไม่สมดุลซ้อนกันในแท่งเทียนเบรกเอาท์แยกการเคลื่อนไหวจริงออกจากกับดัก
• ลดความเหนื่อยล้า: ปริมาณสูงพร้อมเดลต้าหดตัวที่จุดสูง/ต่ำสวิงเป็นสัญญาณการดูดซับ
• อ่านความแตกต่าง: ราคาขึ้น + เดลต้าสะสมลง = การวิ่งขึ้นโดยไม่มีการซื้อจริง
• ปรับปรุงการเข้า: เข้าตลาดที่ POC ของแท่งเทียนหรือระดับความไม่สมดุลแทนราคาที่สุ่ม
⚙️ ปรับแต่งได้เต็มที่
• ขนาดแถวคงที่เป็นพิป หรือขนาดอัตโนมัติที่ปรับตามช่วงของสัญลักษณ์
• ขอบแถวด้วยสีของคุณเอง — ตั้งเป็นพื้นหลังแผนภูมิของคุณและแถวจะแยกเป็นแท่งที่ชัดเจนและเว้นระยะอย่างสม่ำเสมอ
• ควบคุมความไม่สมดุล: เปิด/ปิด, เครื่องหมายหรือลายเส้น, อัตราส่วน และตัวกรองขนาดขั้นต่ำเพื่อทำเครื่องหมายเฉพาะแถวที่มีน้ำหนักจริง
• สลับตัวเลข, ป้ายเดลต้า, เดลต้าสะสม และ POC ของแท่งเทียนได้อย่างอิสระ
• ทุกสีปรับแต่งได้ รวมถึงขีดจำกัดการแสดงผลและขนาดตัวอักษร
• แท่งเทียนถูกซ่อนไว้เบื้องหลังกลุ่มโดยอัตโนมัติ เพื่อรูปลักษณ์ Footprint ที่สะอาดและมืออาชีพ
🧪 ทดลองก่อนซื้อ
มีเวอร์ชันทดลองฟรี — ใช้เอนจินเดียวกัน แสดงแท่งเทียนล่าสุด 15 แท่ง ทดสอบกับข้อมูลโบรกเกอร์ของคุณก่อน จากนั้นอัปเกรดเป็นเวอร์ชันเต็ม
ใช้งานได้กับสัญลักษณ์ใดก็ได้ ประสบการณ์ดีที่สุดบนแผนภูมิ M1–M15 ซื้อครั้งเดียว ไม่มีการสมัครสมาชิก อัปเดตฟรี
สรุป
The indicator updates live with tick-by-tick data and uses smart lazy loading to maintain chart performance. When tick data is unavailable, it switches to an approximate mode based on 1-minute bars, clearly marking these bars. Footprint Pro supports full customization of row sizing, display options (numbers, delta labels, POC, imbalances), color schemes, and imbalance sensitivity.
Traders use Footprint Pro to confirm breakouts, detect exhaustion and absorption, identify divergences between price and volume, and refine entry points based on volume clusters rather than arbitrary prices. It works on any symbol, is optimized for 1- to 15-minute charts, and is available as a one-time purchase with free updates. A free trial version displays the most recent 15 candles for evaluation.