
Descrizione
Ci siamo trasferiti su 👉 PrimeQuant
🚫🚫🚫 Non acquistare questo indicatore!
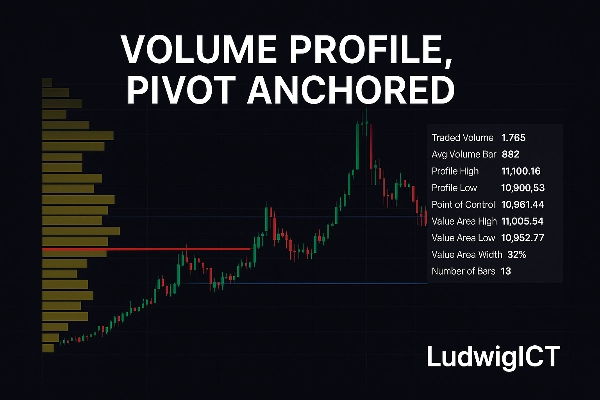
L'indicatore Volume Profile, Pivot Anchored porta un approccio professionale all'analisi della struttura di mercato e del volume direttamente in cTrader. Progettato per trader che apprezzano chiarezza, precisione e intuizioni pratiche, rivela come l'attività di trading sia distribuita lungo il prezzo all'interno di intervalli di swing significativi.
⚡Offerta esclusiva – Limitata ai primi 10 acquirenti!⚡
Sblocca il pieno potenziale della tua strategia di trading con questo potente indicatore personalizzato, progettato per darti un vantaggio preciso sul mercato. Questo strumento è stato creato per trader seri che vogliono segnali chiari e pratici e un miglioramento nelle decisioni quando si fa trading su XAU/USD e altre coppie Forex.
🚀 Perché acquistarlo ora:
Disponibile a un prezzo speciale di lancio – solo per i primi 10 trader
Accedi a intuiti avanzati sull'azione del prezzo
Progettato per alta precisione e affidabilità
Perfetto sia per scalping che swing trading
Una volta vendute 10 copie, questa offerta non sarà più disponibile a questo prezzo. Assicurati la tua copia oggi e porta il tuo trading al livello successivo!
Cosa fa?
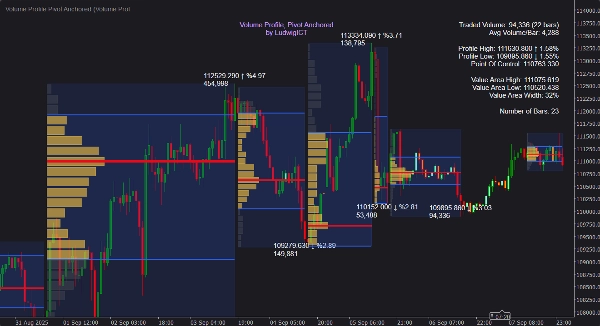
A differenza dei profili fissi o basati sulla sessione, questo strumento ancora automaticamente i profili di volume ai pivot significativi di massimi e minimi, mappando dinamicamente il processo d'asta di ogni swing. Questo rende possibile vedere dove i partecipanti al mercato hanno effettivamente impegnato capitale — non solo dove il prezzo si è mosso.
✨ Gli elementi chiave includono:
📍 Rilevamento automatico dei pivot – I profili sono costruiti tra massimi e minimi di swing, aggiornandosi man mano che si formano nuovi pivot.
📊 Distribuzione dettagliata del volume – Gli istogrammi mostrano come il volume è allocato lungo il prezzo, con risoluzione e larghezza definite dall'utente.
🎯 Livelli di Value Area e POC – Calcolo e visualizzazione istantanea del Punto di Controllo (POC), Value Area High (VAH) e Value Area Low (VAL).
📈 Profilo in sviluppo – Un profilo aggiornato in tempo reale sulla gamba corrente fornisce un contesto prospettico.
➡️ Estensione delle zone POC – Proietta il POC in avanti fino a quando non viene toccato o attraversato dal prezzo, evidenziando zone di reazione future.
📝 Etichette informative e tooltip – Etichette di prezzo, variazione %, volume cumulativo e un pannello statistico pulito al passaggio del mouse.
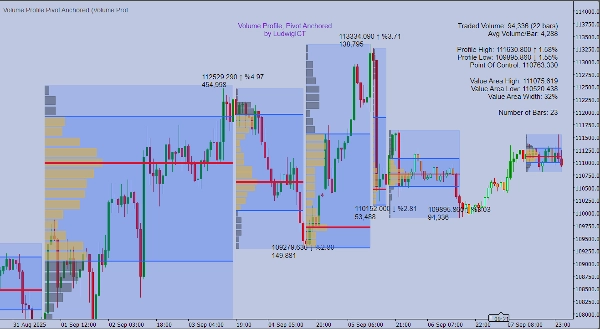
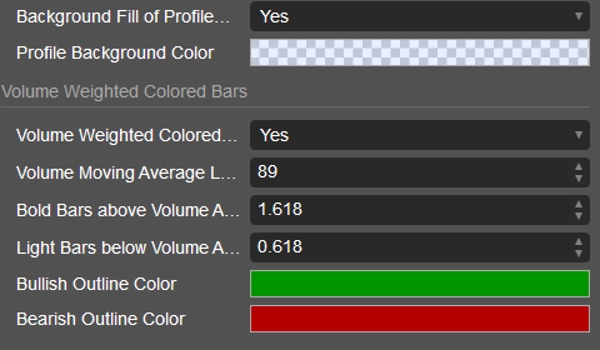
🎨 Colorazione delle barre ponderata per volume – Candele ombreggiate in base all'intensità del volume per un rapido riconoscimento dei pattern.
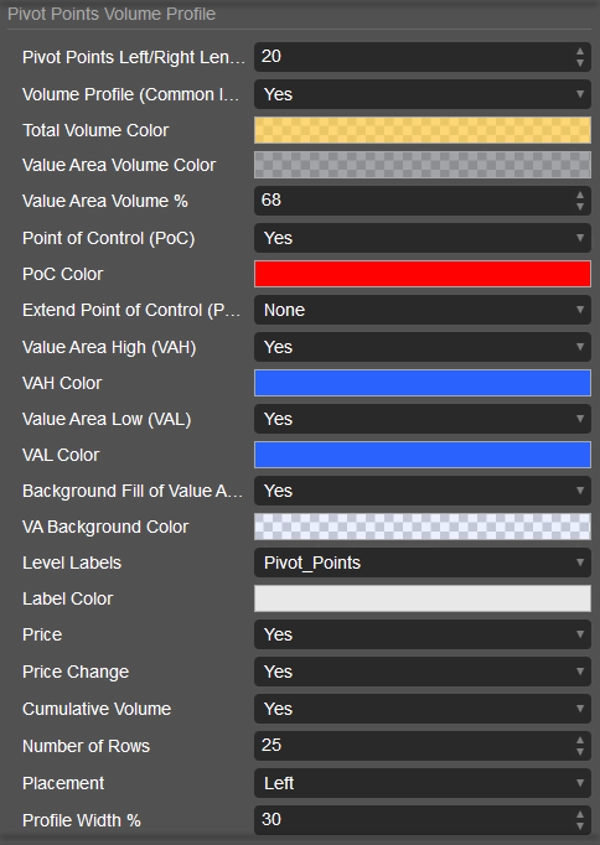
⚙️ Personalizzazione completa – Regola colori, posizionamento e visualizzazione per integrarsi perfettamente con lo stile del tuo grafico.
Come usarlo
1️⃣ Collegalo a qualsiasi grafico – funziona su tutti i timeframe e strumenti.
2️⃣ Regola la lunghezza del pivot – controlla la sensibilità ai massimi/minimi di swing (più corto = più profili, più lungo = solo struttura principale).
3️⃣ Interpreta i profili nel contesto:
• 🎯 POC – livello di prezzo con il volume più scambiato, spesso un magnete.
• 📏 VAH / VAL – confini dell'area di valore, supporto/resistenza potenti.
• 🌀 Forma dell'istogramma – identifica aree di equilibrio, zone di rifiuto e cambiamenti di distribuzione.
4️⃣ Osserva il profilo in sviluppo – segui come si costruisce la struttura d'asta in tempo reale.
5️⃣ Usa gli alert – ricevi notifiche quando il prezzo interagisce con POC, VAH, VAL o quando appaiono barre ad alto volume.
6️⃣ Applicalo come framework – affina gli ingressi a livelli basati sul volume, anticipa inversioni e conferma trend tramite la struttura del volume.
Perché i trader lo usano
Questo indicatore traduce il volume grezzo in una struttura significativa. Ancora i profili ai pivot, si adatta alla dinamica di mercato in tempo reale invece di affidarsi a divisioni arbitrarie di sessione. Che si tratti di trading intraday, swing o posizionale, la distribuzione del volume ancorata offre una chiarezza più profonda per prendere decisioni.
Parametri chiave a colpo d'occhio
⚙️ Sensibilità del pivot – definisci quanto aggressivamente vengono rilevati i punti di swing.
📊 Livelli e larghezza del profilo – controlla risoluzione e visibilità del profilo.
🎯 Modalità di estensione POC – Nessuna, fino all'ultima barra, fino al tocco o fino all'attraversamento.
📏 Percentuale dell'area di valore – completamente regolabile (default 68%).
🎨 Colorazione del volume – soglie per evidenziare partecipazione forte/debole.
Volume Profile, Pivot Anchored di LudwigICT non è una visualizzazione generica — è una lente strutturale su come i mercati effettivamente fanno le aste. Per i trader che richiedono strumenti professionali, fornisce un vantaggio decisivo nella lettura dell'interazione tra prezzo e volume.
Se hai domande o riscontri problemi, non esitare a contattarmi. Sono felice di aiutarti!
Disclaimer:
Utilizzando i miei algoritmi, riconosci che il trading comporta rischi intrinseci e che le performance passate non garantiscono risultati futuri. È essenziale avere una solida strategia di gestione del rischio e, soprattutto, mantenere la disciplina nel rispettare i livelli di stop-loss. La mancata gestione corretta del rischio può portare a perdite significative. Non sono responsabile per alcun risultato finanziario derivante dall'uso di questi algoritmi. Fai trading responsabilmente e segui sempre le corrette pratiche di gestione del rischio.
Bless up! 🙌
Riepilogo
Recensioni dei clienti
5 | 67 % | |
4 | 33 % | |
3 | 0 % | |
2 | 0 % | |
1 | 0 % |


