
Deskripsi
⚠️ Kami pindah ke 👉 PrimeQuant
🚫🚫🚫 Jangan beli indikator ini!
⚡ VERSI GENERASI BERIKUTNYA TERSEDIA: Alat klasik LudwigICT ini telah didesain ulang, direstrukturisasi, dan dirilis kembali di bawah merek pengembang baru kami, PrimeQuant. Versi baru ini menampilkan antarmuka yang disederhanakan dan properti yang diperbarui untuk kondisi pasar saat ini. Dapatkan versi yang ditingkatkan dengan harga diskon di sini:
👉 ALMA-Gaussian Trend Filter
👉 ALMA-Gaussian Trend Filter
👉 ALMA-Gaussian Trend Filter
(Harap dicatat: Daftar LudwigICT tetap aktif untuk pengguna lama tetapi tidak akan menerima pembaruan atau diskon harga aktif lagi.)
ALMA Smoothed Gaussian Moving Average (ASGMA) – oleh LudwigICT
Sebuah indikator mengikuti tren presisi yang menggabungkan perataan ALMA dengan Gaussian Moving Average adaptif untuk memotong kebisingan dan mengungkap bias pasar yang sebenarnya.
🔹 Cara kerjanya:
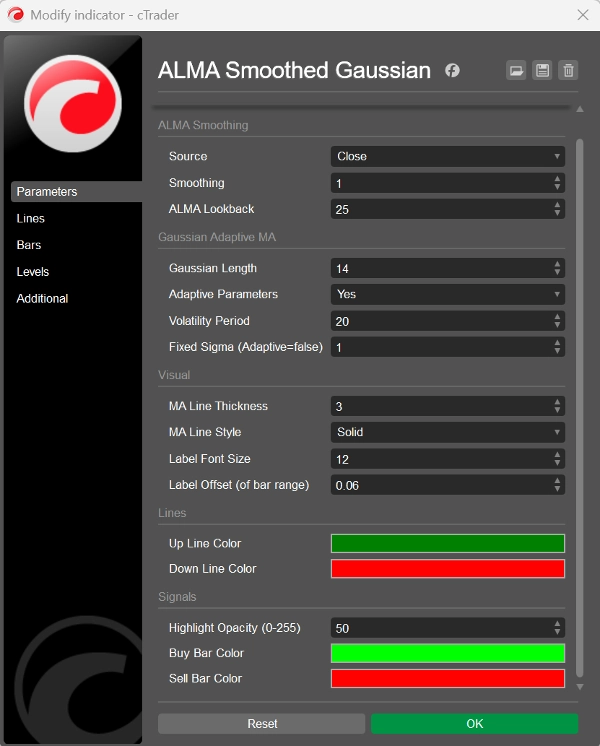
- Mengambil sumber harga pilihan Anda (Close, Open, High, Low, HL2, HLC3, OHLC4).
- Mengukur perubahan persentase dan meratakannya dengan ALMA (Arnaud Legoux MA).
- Menerapkan filter Gaussian (adaptif terhadap volatilitas, atau tetap) untuk garis tren yang lebih halus.
- Mengonfirmasi arah dengan EMA dari close (7) untuk penyelarasan yang responsif.
🔹 Apa yang Anda lihat di grafik:
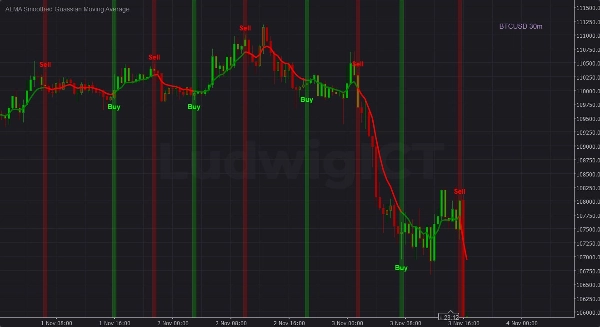
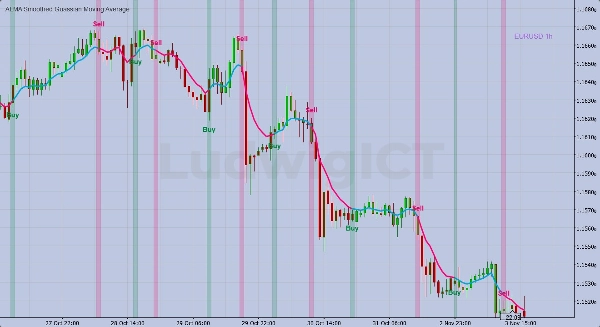
- Garis tren: Hijau = tren naik, Merah = tren turun.
- Lilinnya diwarnai ulang: Warna badan & sumbu yang selaras dengan tren untuk pengenalan bias instan.
- Sinyal Beli/Jual: Bar yang disorot + label tebal saat ALMA melintasi di atas/bawah Gaussian MA.
- Sorotan penuh tinggi: Tetap terlihat saat pan/zoom (tidak ada sinyal yang terlewat).
🔹 Apa yang diberikan kepada trader:
✅ Sebuah peta tren yang bersih dan tanpa lag
✅ Sinyal Beli/Jual cepat saat pergeseran momentum
✅ Lebih sedikit kekacauan di grafik, lebih percaya diri dalam eksekusi
👉 Singkatnya: Ini adalah indikator tren presisi yang menyaring kebisingan, beradaptasi dengan volatilitas, dan memberikan sinyal Beli/Jual visual yang jelas.
Jika Anda memiliki pertanyaan atau mengalami masalah, jangan ragu untuk menghubungi saya. Saya senang membantu Anda!
Penafian:
Dengan menggunakan algoritma saya, Anda mengakui bahwa perdagangan melibatkan risiko inheren dan bahwa kinerja masa lalu tidak menjamin hasil di masa depan. Sangat penting untuk memiliki strategi manajemen risiko yang solid dan, yang terpenting, tetap disiplin dalam mematuhi level stop-loss. Kegagalan dalam mengelola risiko dengan benar dapat menyebabkan kerugian signifikan. Saya tidak bertanggung jawab atas hasil keuangan yang timbul dari penggunaan algoritma ini. Berdaganglah dengan bertanggung jawab dan selalu ikuti praktik manajemen risiko yang tepat.
Semoga beruntung! 🙌
Ringkasan
Ulasan pelanggan
5 | 33 % | |
4 | 67 % | |
3 | 0 % | |
2 | 0 % | |
1 | 0 % |


