
Deskripsi
Kami pindah ke 👉 PrimeQuant
🚫🚫🚫 Jangan beli indikator ini!
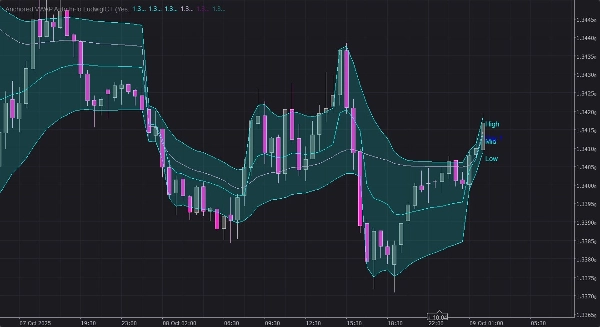
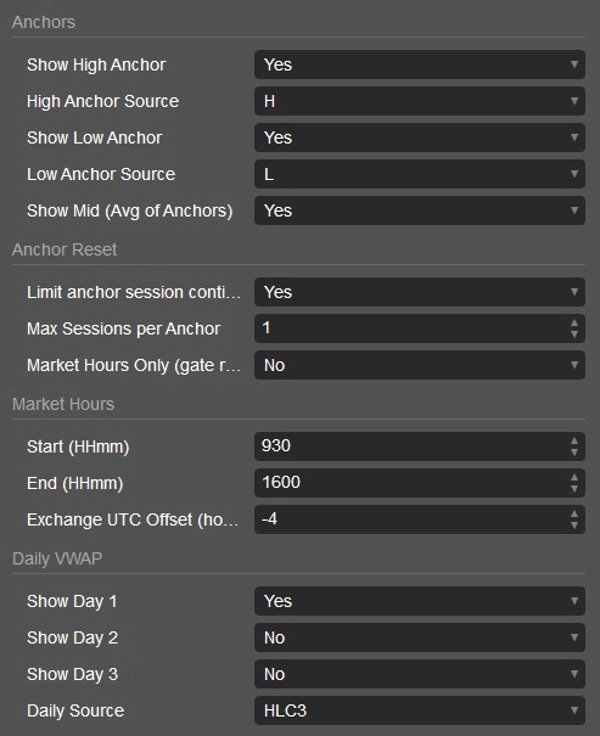
1. Anchored VWAP High & Low
- Melacak dua garis VWAP berjangkar terpisah:
-
- Anchor Tinggi → VWAP mulai dari titik “breakout tinggi” terbaru.
- Anchor Rendah → VWAP mulai dari titik “breakout rendah” terbaru.
- Anchor direset ketika:
-
- Harga menembus di atas anchor tinggi sebelumnya (untuk anchor tinggi) atau di bawah anchor rendah sebelumnya (untuk anchor rendah).
- Atau setelah sejumlah sesi tertentu (misalnya, 1 hari) jika SessionLimited diaktifkan.
- Opsional, reset hanya terjadi selama jam pasar yang ditentukan.
- Juga dapat menampilkan Midline = rata-rata dari VWAP berjangkar tinggi dan rendah.
2. Kontrol Sesi & Jam Pasar
- SessionLimited: Membatasi berapa lama anchor dapat bertahan antar sesi (hari perdagangan).
- AnchorMaxSessions: Jumlah maksimum sesi sebelum reset otomatis.
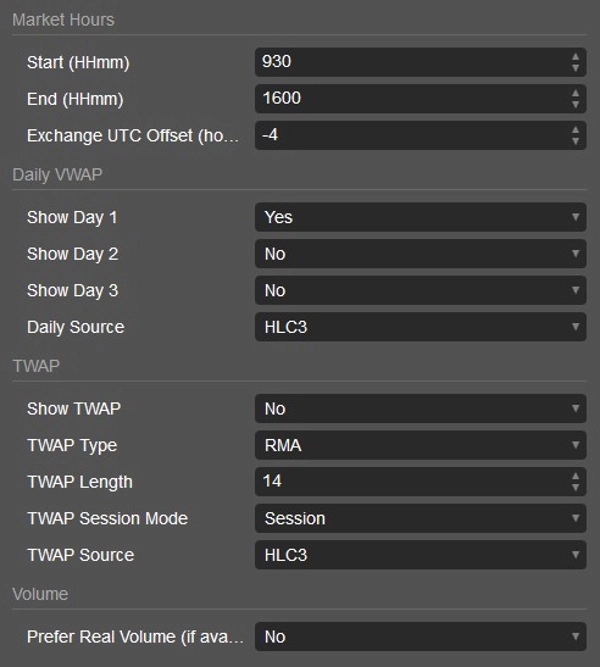
- MarketHoursOnly: Mencegah reset di luar waktu mulai/berakhir yang dipilih (misalnya, RTH untuk saham).
- ExchangeUtcOffsetHours: Menyesuaikan waktu jam pasar ke bursa yang Anda pilih.
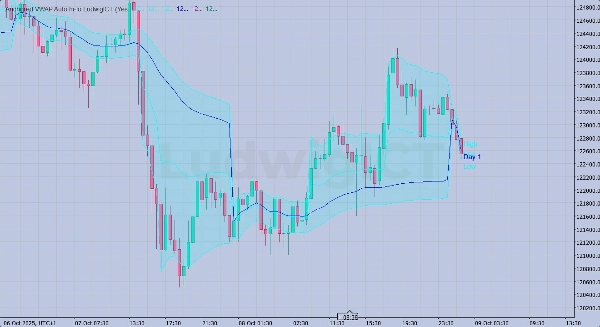
3. VWAP Harian untuk 3 Hari Terakhir
- Melacak VWAP harian untuk:
-
- Hari 1 (hari ini)
- Hari 2 (kemarin)
- Hari 3 (dua hari lalu)
- Semua ini dapat ditampilkan bersama untuk memvisualisasikan level VWAP jangka pendek.
4. TWAP (Harga Rata-rata Tertimbang Waktu)
- Garis opsional yang menunjukkan TWAP berdasarkan metode rata-rata bergerak yang berbeda:
-
- SMA, EMA, RMA, WMA, VWMA, atau Regresi Linear.
- Dapat direset setiap sesi (mode Sesi) atau berjalan terus-menerus (mode Perpetual).
- Panjang dapat disesuaikan, dan tipe harga sumber dapat dipilih.
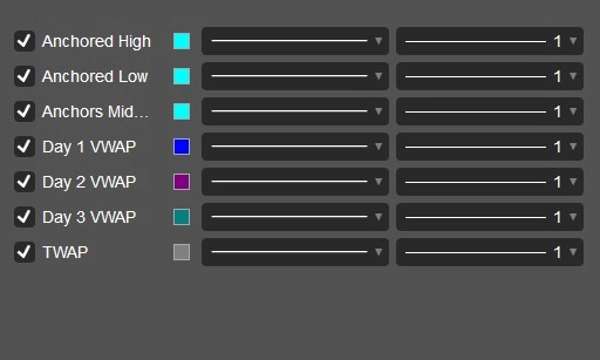
5. Output Visual
- Menggambar garis untuk:
-
- VWAP Tinggi Berjangkar
- VWAP Rendah Berjangkar
- Midline Berjangkar
- VWAP Hari 1, 2, 3
- TWAP
- Juga menggambar label pada bar terakhir yang menunjukkan garis mana yang mana.
6. Penanganan Volume
- Menggunakan volume tick secara default (standar cTrader).
- Dapat memilih volume nyata jika tersedia.
💡 Dalam istilah trading:
Indikator ini terutama untuk melacak level VWAP berjangkar dari titik ayunan kunci (tinggi/rendah terbaru), sekaligus melacak riwayat VWAP jangka pendek dan opsional menampilkan TWAP. Dirancang untuk trader yang menginginkan pelacakan VWAP berbasis sesi yang presisi dengan aturan reset mirip versi Pine asli, namun dengan peningkatan untuk pengaturan jam pasar dan referensi VWAP/TWAP ganda.
Jika Anda memiliki pertanyaan atau mengalami masalah, jangan ragu untuk menghubungi saya. Saya senang membantu Anda!
Penafian:
Dengan menggunakan algoritma saya, Anda mengakui bahwa trading melibatkan risiko inheren dan bahwa kinerja masa lalu tidak menjamin hasil di masa depan. Sangat penting untuk memiliki strategi manajemen risiko yang solid dan, yang terpenting, tetap disiplin dalam mematuhi level stop-loss. Kegagalan mengelola risiko dengan benar dapat menyebabkan kerugian signifikan. Saya tidak bertanggung jawab atas hasil keuangan yang timbul dari penggunaan algoritma ini. Berdaganglah dengan bertanggung jawab dan selalu ikuti praktik manajemen risiko yang tepat.
Semoga beruntung! 🙌
Ringkasan
The indicator also displays a Midline, calculated as the average of the high and low anchored VWAPs, and tracks daily VWAP levels for the last three days to provide short-term VWAP history. Additionally, it offers an optional Time-Weighted Average Price (TWAP) line, which can be calculated using various moving average methods (SMA, EMA, RMA, WMA, VWMA, or Linear Regression) and configured to reset each session or run continuously.
Session and market hours controls include options to limit anchor duration across sessions, set maximum sessions before reset, restrict resets to market hours, and adjust for exchange time zones. The indicator uses tick volume by default but can be set to prefer real volume if available. Visual outputs include labeled lines for anchored high, low, midline VWAPs, daily VWAPs, and TWAP, aiding traders in precise session-based VWAP analysis with enhanced reset and market-hour features.
Ulasan pelanggan
5 | 67 % | |
4 | 33 % | |
3 | 0 % | |
2 | 0 % | |
1 | 0 % |


