
Deskripsi
⚠️ Kami pindah ke 👉 PrimeQuant
🚫🚫🚫 Jangan beli indikator ini!
🎯 Ikhtisar
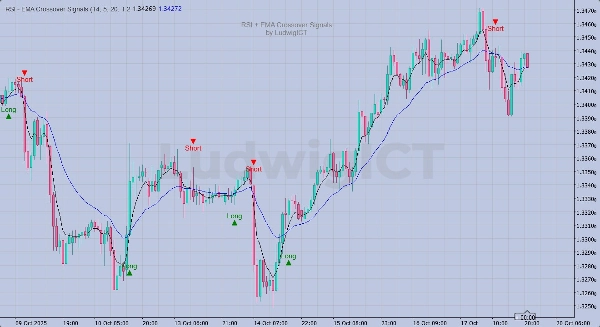
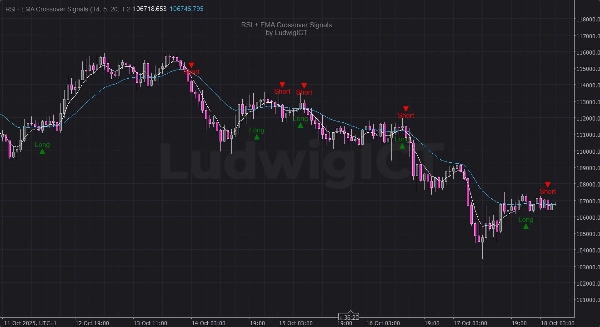
Indikator RSI + EMA Crossover Signals oleh LudwigICT menggabungkan momentum dan konfirmasi tren untuk menghasilkan sinyal trading Long/Short dengan kepercayaan tinggi — langsung di grafik Anda.
⚙️ Cara Kerja:
- Tahap Sinyal RSI:
-
- Sinyal diaktifkan ketika RSI melintasi garis sinyal SMA-nya sendiri.
- Tahap Konfirmasi EMA:
-
- Sinyal dipicu hanya ketika EMA cepat dan lambat berpotongan ke arah yang sama.
- Pembatalan Sinyal:
-
- Setiap crossover berlawanan (RSI atau EMA) membatalkan sinyal yang belum dipicu.
✨ Fitur Utama:
- 🔁 Logika konfirmasi ganda (RSI + EMA)
- 📈 Ikon Long dan Short yang jelas dipetakan langsung di grafik
- ⚡ Offset visual berbasis ATR yang dinamis (menyesuaikan otomatis dengan volatilitas)
- 💧 Overlay bersih dengan watermark permanen
- 🧠 Logika “pengaktifan” dan “pembatalan” cerdas untuk mengurangi pemicu palsu
- 🧮 Parameter RSI, EMA, dan offset yang sepenuhnya dapat disesuaikan
🔧 Input:
- Periode RSI (default: 14)
- EMA Cepat (default: 5)
- EMA Lambat (default: 20)
- Offset Sinyal (pengali ATR, default: 1.2)
📊 Ideal Untuk:
- Trader momentum
- Sistem konfirmasi tren
- Strategi trading manual atau semi-otomatis
📅 Pembaruan Versi:
- ✅ Menambahkan offset dinamis berbasis ATR untuk visual yang lebih jelas
- ✅ Meningkatkan logika akurasi sinyal
- ✅ Menambahkan watermark yang tidak dapat dihapus untuk keaslian
© 2025 LudwigICT — Semua Hak Dilindungi.
Jika Anda memiliki pertanyaan atau mengalami masalah, jangan ragu untuk menghubungi saya. Saya senang membantu Anda!
Penafian:
Dengan menggunakan algoritma saya, Anda mengakui bahwa trading melibatkan risiko inheren dan bahwa kinerja masa lalu tidak menjamin hasil di masa depan. Sangat penting untuk memiliki strategi manajemen risiko yang solid dan, di atas semua itu, tetap disiplin dalam mematuhi level stop-loss. Kegagalan dalam mengelola risiko dengan benar dapat menyebabkan kerugian signifikan. Saya tidak bertanggung jawab atas hasil keuangan yang timbul dari penggunaan algoritma ini. Berdaganglah dengan bertanggung jawab dan selalu ikuti praktik manajemen risiko yang tepat.
Semoga sukses! 🙌
Ringkasan
Ulasan pelanggan
5 | 0 % | |
4 | 100 % | |
3 | 0 % | |
2 | 0 % | |
1 | 0 % |


