
Descrizione
⚠️ Ci siamo spostati su 👉 PrimeQuant
🚫🚫🚫 Non acquistare questo indicatore!
⚡ VERSIONE DI NUOVA GENERAZIONE DISPONIBILE: Questo classico strumento LudwigICT è stato riprogettato, ristrutturato e rilanciato sotto il nostro nuovo marchio di sviluppatore, PrimeQuant. La nuova versione presenta un'interfaccia utente semplificata e proprietà aggiornate per le condizioni di mercato attuali. Ottieni la versione aggiornata a un prezzo scontato per i clienti storici qui:
👉 Rilevamento automatico delle onde di Elliott + Fibonacci
👉 Rilevamento automatico delle onde di Elliott + Fibonacci
👉 Rilevamento automatico delle onde di Elliott + Fibonacci
(Si prega di notare: l'inserzione LudwigICT rimane attiva per gli utenti storici ma non riceverà più aggiornamenti o sconti attivi.)
📈 Onde di Elliott – Livelli di Fibonacci [LudwigICT]
🔥 Sblocca tutta la potenza della Teoria delle Onde di Elliott combinata con ritracciamenti di Fibonacci dinamici – tutto automatizzato per te all'interno di cTrader!
Questo indicatore porta il conteggio delle onde di livello professionale e zone precise di Fibonacci direttamente sui tuoi grafici, rendendo la previsione delle tendenze e l'esecuzione delle operazioni più facili che mai.
✨ Caratteristiche principali
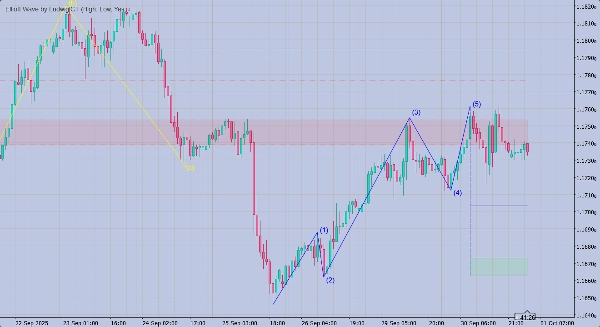
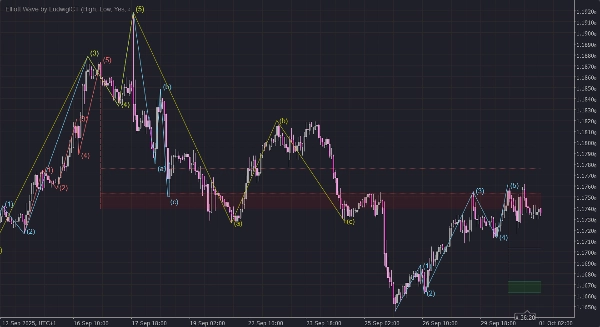
🔹 Rilevamento automatico delle onde
- Identifica strutture motrici a 5 onde (1–5).
- Rileva schemi correttivi a 3 onde (A–B–C) immediatamente dopo il completamento della motrice.
🔹 Ritracciamenti di Fibonacci dinamici
- Traccia automaticamente le zone chiave di ritracciamento: 0.500 • 0.618 • 0.764 • 0.854.
- Si aggiorna in tempo reale con lo sviluppo delle onde.
- Evidenzia le invalidazioni con linee tratteggiate.
🔹 Framework Multi-ZigZag
- Esegue tre calcoli ZigZag indipendenti con lunghezza e colori personalizzabili.
- Garantisce sensibilità flessibile per diverse condizioni di mercato.
🔹 Aspetti visivi professionali
- Etichette delle onde pulite
(1)…(5)e(a)(b)(c)posizionate con offset intelligenti basati su ATR. - Riquadri di breakout con marcatori X in grassetto quando i livelli vengono superati.
- Aree di riempimento Fibonacci a gradiente per una facile individuazione.
🔹 Assistenza al trading
- Identificazione automatica di una possibile nuova Onda (1) dopo la correzione A–B–C.
- Avvisi audio per nuove onde, invalidazioni e segnali di breakout.
🛠 Come usare
- Applica al grafico
-
- Trascina semplicemente Elliott Wave – Fibonacci Levels [LudwigICT] sul tuo grafico cTrader.
- Funziona su tutti i timeframe (scalping, swing, lungo termine).
- Personalizza i parametri
- Leggi le onde
-
- ✅ Onde
(1–5)= Onda motrice (direzione del trend). - 🔄 Onde
(a–b–c)= Onda correttiva (controtendenza). - 📊 I livelli di Fibonacci mostrano probabili zone di ritracciamento per ingressi/uscite.
- ✅ Onde
- Fai trading con fiducia
-
- Entra nelle operazioni intorno ai ritracciamenti di Fibonacci dopo un'onda motrice completata.
- Gestisci il rischio quando i livelli vengono superati (l'indicatore ti avvisa automaticamente).
- Cerca l'icona Next Wave (1) per anticipare nuovi cicli di trend.
🎯 Perché scegliere questo indicatore?
✅ Risparmia ore di conteggio manuale delle onde.
✅ Evita errori soggettivi nell'analisi delle onde di Elliott.
✅ Aspetti visivi puliti, precisi e professionali direttamente sul tuo grafico.
✅ Creato e ottimizzato da LudwigICT, affidabile nell'automazione del trading.
🖥 Compatibilità
- Piattaforma: cTrader Desktop v5+
- Strumenti: Funziona su Forex, Azioni, Indici, Materie prime, Cripto.
- Timeframe: Da scalping 1m a analisi swing settimanale.
⚡️ Inizia ora
🚀 Aggiungi Elliott Wave – Fibonacci Levels [LudwigICT] al tuo arsenale di trading oggi e porta la tua analisi grafica al livello successivo!
👉 Perfetto per i trader che si affidano a price action, struttura e ritracciamenti di Fibonacci per temporizzare con precisione ingressi e uscite.
Se hai domande o riscontri problemi, non esitare a contattarmi. Sono felice di aiutarti!
Disclaimer:
Utilizzando i miei algoritmi, riconosci che il trading comporta rischi intrinseci e che le prestazioni passate non garantiscono risultati futuri. È essenziale avere una solida strategia di gestione del rischio e, soprattutto, rimanere disciplinati nel rispettare i livelli di stop-loss. La mancata gestione corretta del rischio può portare a perdite significative. Non sono responsabile per eventuali risultati finanziari derivanti dall'uso di questi algoritmi. Fai trading responsabilmente e segui sempre le corrette pratiche di gestione del rischio.
Bless up! 🙌
Riepilogo
Recensioni dei clienti
5 | 100 % | |
4 | 0 % | |
3 | 0 % | |
2 | 0 % | |
1 | 0 % |


