
WVAP-Bands Indicator_noSourceCode
Indicatore
1 acquisti
Versione 1.0, Sep 2025
Windows, Mac
4.5
Recensioni: 2
Descrizione
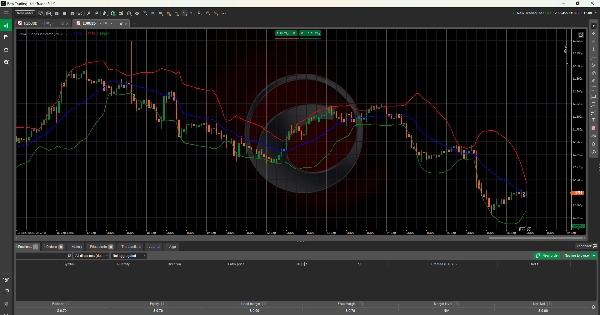
VWAP Bands - Analisi del Volume Professionale
Trasforma il Tuo Trading con Precisione di Livello Istituzionale
L'indicatore VWAP Bands offre un'analisi professionale del prezzo ponderato per il volume con bande di deviazione standard dinamiche. Utilizzato da trader istituzionali in tutto il mondo per identificare i punti ottimali di ingresso e uscita.
🚀 Caratteristiche Principali
- Calcolo VWAP Reale: Prezzo medio ponderato per il volume usando la metodologia HLC/3
- Bande Dinamiche: Bande superiori/inferiori basate sulla deviazione standard ponderata per il volume
- Personalizzazione Completa: Periodi regolabili, colori e moltiplicatori della larghezza delle bande
- Analisi in Tempo Reale: Aggiornamenti ad ogni barra per una visione immediata del mercato
📊 Applicazioni di Trading
- Ipercomprato/Ipervenduto: Banda superiore = segnali di vendita, Banda inferiore = segnali di acquisto
- Supporto/Resistenza Dinamici: VWAP agisce come livello di riferimento istituzionale
- Ritorno alla Media: Scambi di inversione quando il prezzo si estende agli estremi delle bande
- Conferma del Trend: Forti rotture attraverso le bande segnalano la continuazione
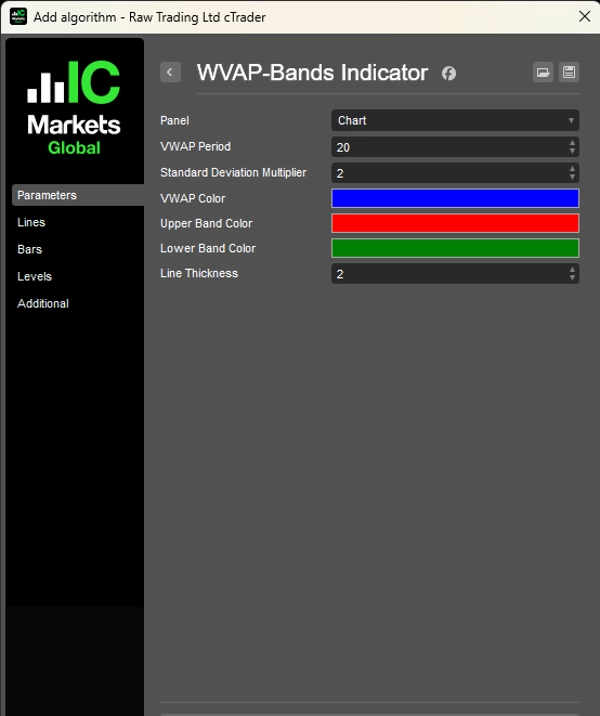
⚙️ Impostazioni Professionali
- Periodo VWAP: 1-200 barre (default: 20)
- Deviazione Standard: moltiplicatore 0.1-5.0 (default: 2.0)
- Personalizzazione Visiva: Colori personalizzati e spessore delle linee
- Multi-Timeframe: Funziona su tutti i timeframe e strumenti
✅ Perché VWAP Bands?
Superiori alle semplici medie mobili, le VWAP Bands offrono:
- Precisione ponderata per il volume per una vera analisi istituzionale
- Volatilità adattiva bande che si adattano alle condizioni di mercato
- Metodologia professionale utilizzata da trader di successo a livello globale
- Applicazione universale su forex, azioni, criptovalute e materie prime
Perfetto per scalper, day trader e swing trader che cercano un'analisi professionale del volume.
Compatibile con cTrader 4.0+. Funziona su tutti gli strumenti e timeframe.
Riepilogo
Riepilogo AI
The WVAP-Bands Indicator provides volume-weighted average price (VWAP) analysis enhanced with dynamic standard deviation bands. It calculates VWAP using the HLC/3 price method and overlays upper and lower bands based on volume-weighted standard deviation, offering adaptive volatility measures. The indicator supports full customization of periods, colors, and band width multipliers, allowing traders to tailor it to their strategies. It updates in real time with each new bar, delivering immediate market insights.
Key trading applications include identifying overbought and oversold conditions (upper band signals sell, lower band signals buy), dynamic support and resistance levels with VWAP as an institutional reference, mean reversion opportunities when prices reach band extremes, and trend confirmation through breakouts beyond the bands. Settings allow adjustment of VWAP period (1–200 bars), standard deviation multiplier (0.1–5.0), and visual elements such as colors and line thickness.
The indicator is compatible with all timeframes and instruments, including forex, stocks, cryptocurrencies, commodities, and indices. It is designed for scalpers, day traders, and swing traders seeking professional-grade volume analysis and is compatible with cTrader 4.0 and above.
Profilo indicatore
Recensioni dei clienti
4.5
Recensioni: 2
5 | 50 % | |
4 | 50 % | |
3 | 0 % | |
2 | 0 % | |
1 | 0 % |
Recensioni dei clienti
October 4, 2025
The sample size matters. The useful metric is POC and VWAP first, compare the result with 20 reactions, and only scale if 2 sessions still looks controlled.
October 3, 2025
I liked it more as a extra filter for volume based context than as something to follow blindly. Pressure is easier to read, and the final decision still feels like it belongs to the trader. The next review on it on value area.
Discussioni
Domande frequenti
BTCUSD
Forex
Signal
Breakout
Indices
EURUSD
Commodities
GBPUSD
NZDUSD
Prop
Scalping
Crypto
Stocks
XAUUSD
NAS100
USDJPY
VWAP
I prodotti disponibili tramite cTrader Store, inclusi bot di trading, indicatori e plugin, sono forniti da sviluppatori terzi e resi disponibili esclusivamente a scopo informativo e di accesso tecnico. cTrader Store non è un broker e non fornisce consulenze in materia di investimento, raccomandazioni individualizzate o garanzie di risultati futuri.
Altro da questo autore


Prezzo
Da 15/01/2025
7
Vendite