
Descrizione
Profilo del Volume della Sessione HD
Cosa Fa
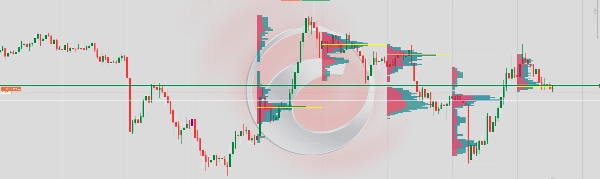
Visualizza un profilo del volume orizzontale per ogni sessione di trading direttamente sul grafico. Mostra come il volume di trading è distribuito tra i livelli di prezzo, aiutando i trader a identificare zone di alta attività, aree di valore equo e livelli chiave di supporto/resistenza derivati esclusivamente dal comportamento del volume.
Come Funziona
Ad ogni chiusura di una nuova barra, l'indicatore analizza tutte le barre all'interno del numero definito di sessioni e distribuisce il volume tick di ogni barra lungo il suo intervallo di prezzo. Il volume è suddiviso in lato acquisto (barre rialziste) e lato vendita (barre ribassiste) usando la direzione di apertura/chiusura della barra come proxy. Il risultato è rappresentato come un istogramma orizzontale stratificato ancorato al confine temporale della sessione.
Elementi Visivi
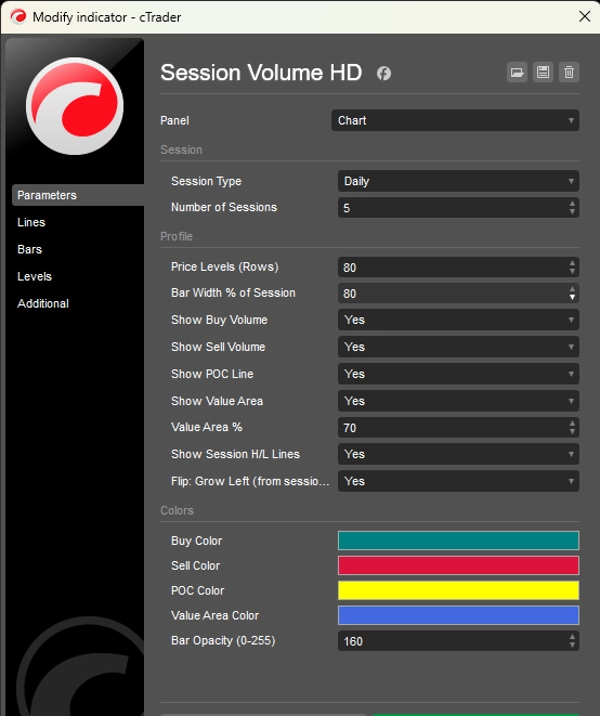
Barre di Acquisto (Turchese) — Mostrano il volume scambiato durante movimenti di prezzo rialzisti a ogni livello. Crescono verso sinistra (o verso destra se capovolto) dall'ancora della sessione.
Barre di Vendita (Rosso) — Mostrano il volume scambiato durante movimenti di prezzo ribassisti a ogni livello, impilate accanto alle barre di acquisto.
Linea POC (Gialla) — Punto di Controllo. Una linea orizzontale che segna il livello di prezzo con il volume totale più alto nella sessione. Agisce come un magnete per il prezzo.
Area di Valore (Sovrapposizione Blu) — L'intervallo di prezzo che contiene una percentuale configurabile (default 70%) del volume totale della sessione. Rappresenta la zona di "valore equo" dove si è svolta la maggior parte del trading.
Linee H/L della Sessione (Punteggiate Bianche) — Segnano il prezzo più alto e più basso raggiunto durante la sessione.
Prestazioni
L'indicatore ridisegna solo una volta per ogni nuova barra, non ad ogni tick. Questo elimina il lampeggiamento e garantisce un rendering stabile anche con molte sessioni e un alto numero di livelli di prezzo.
Limitazioni
Poiché cTrader non espone il vero volume bid/ask a livello di barra senza un feed di dati tick, il volume di acquisto/vendita è approssimato usando la direzione della barra: le barre rialziste sono ponderate 65% acquisto / 35% vendita, le barre ribassiste il contrario, e le barre doji sono divise 50/50. Per un vero volume delta sarebbe necessaria una sottoscrizione ai dati tick.


