
Descrizione
Indicatore Market Profile
Cosa fa Mappa la distribuzione dei prezzi nel tempo utilizzando blocchi TPO (Time Price Opportunity), rivelando dove il mercato ha trascorso più tempo e dove ha respinto il prezzo.
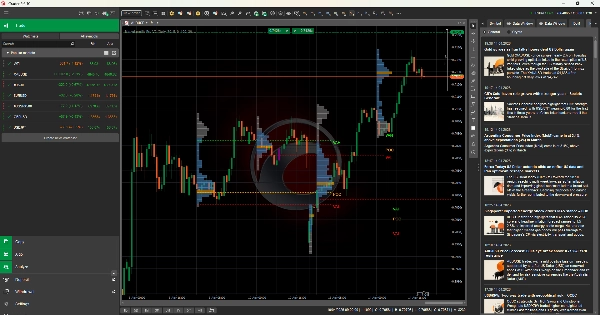
Elementi visivi chiave — POC (Point of Control): livello di prezzo con il volume/tempo più alto — VAH / VAL: confini superiore e inferiore dell'Area di Valore (70% dell'attività) — Forma del profilo: curva a campana = bilanciata; asimmetrica = in trend
Segnali e interpretazione — Prezzo sopra VAH = opportunità di breakout rialzista o di ritracciamento — Prezzo sotto VAL = configurazione di breakdown ribassista o inversione — Il POC agisce come un magnete; il prezzo spesso ruota verso di esso — Zone di profilo sottili = movimento rapido del prezzo, bassa accettazione
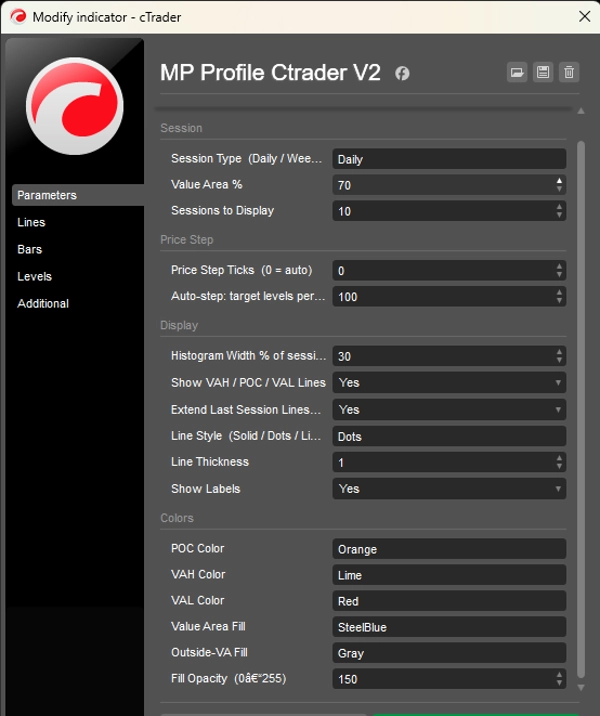
Impostazioni chiave — Tipo di sessione: RTH / ETH / Settimanale — Percentuale Area di Valore: default 70% — Dimensione blocco TPO: dipendente dal timeframe
Casi d'uso — Identificare ingressi a elevata probabilità di rientro alla media a VAH/VAL — Confermare breakout di trend quando il prezzo esce dall'area di valore — Definire il bias intraday usando livelli di riferimento overnight
Profilo del trader Più adatto a trader da intermedi a esperti in futures, forex o azioni che utilizzano grafici da 15m a 4H.
Limitazioni — Intrinsecamente ritardato; confermare sempre con l'azione del prezzo — Meno efficace in sessioni a basso volume o guidate da notizie
Riepilogo
The indicator provides signals for trading decisions: prices above VAH may indicate bullish breakouts or fade opportunities, while prices below VAL suggest bearish breakdowns or reversal setups. The POC often acts as a magnet, with price tending to rotate back to it. Thin profile zones correspond to rapid price movements with low acceptance.
Key settings include session type selection (Regular Trading Hours, Extended Trading Hours, or Weekly), adjustable Value Area percentage, and TPO block size based on timeframe. It is designed for intermediate to advanced traders using 15-minute to 4-hour charts across futures, forex, and equities markets. Use cases include identifying mean-reversion entries, confirming trend breakouts, and defining intraday bias with overnight reference levels. The indicator is volume-dependent and best used alongside price action confirmation.
Recensioni dei clienti
5 | 0 % | |
4 | 100 % | |
3 | 0 % | |
2 | 0 % | |
1 | 0 % |


