
Footprint Chart_noSourceCode
Indikator
1 käufe
Version 1.0, Sep 2025
Windows, Mac
4.3
Bewertungen: 3
Beschreibung
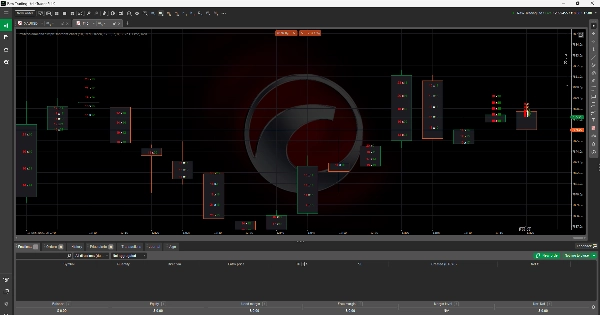
Footprint-Chart-Indikator
Der Footprint-Chart-Indikator bietet Händlern eine detaillierte Ansicht des Orderflusses, indem er das Bid- und Ask-Volumen direkt in jeder Preiskerze anzeigt. Im Gegensatz zu herkömmlichen Kerzendiagrammen ermöglicht dieses Tool den Nutzern, zu sehen, wo Kauf- und Verkaufsdruck auf bestimmten Preisniveaus konzentriert ist. Durch die Hervorhebung von Ungleichgewichten zwischen Käufern und Verkäufern bietet es tiefere Einblicke in Markttiefe, Liquidität und Handelsaktivität. Dies macht es zu einem unverzichtbaren Werkzeug für Händler, die ihre Einstiege, Ausstiege und das Risikomanagement durch fortgeschrittene Orderflussanalyse verfeinern möchten.
Zusammenfassung
KI-Zusammenfassung
The Footprint Chart Indicator enhances traditional candlestick charts by displaying bid and ask volumes within each price candle. This visualization allows traders to observe buying and selling pressure at specific price levels, revealing imbalances between buyers and sellers. By providing detailed insights into order flow, market depth, liquidity, and trading activity, the indicator supports more precise trade entries, exits, and risk management decisions. It is applicable across various markets including Forex, cryptocurrencies (e.g., BTCUSD), commodities, indices, and stocks. The tool is designed for traders who utilize advanced order flow analysis to refine their strategies.
Indikatorprofil
Kundenbewertungen
4.3
Bewertungen: 3
5 | 67 % | |
4 | 0 % | |
3 | 33 % | |
2 | 0 % | |
1 | 0 % |
Kundenbewertungen
September 29, 2025
This fits volume based context better as a review layer. The first forward check can be 97 setups on M1, with 20 reactions and manual notes.
September 26, 2025
More useful for someone who wants less noise in the process. The best use is checking participation and pressure, then leaving the final filter manual.
September 23, 2025
I liked it more as a confirmation layer for volume based context than as something to follow blindly. Pressure is easier to read, and the final decision still feels like it belongs to the trader. Light sizing makes the early sample easier to judge.
Diskussion
Häufig gestellte Fragen (FAQ)
BTCUSD
Forex
Signal
Indices
EURUSD
Commodities
GBPUSD
NZDUSD
Prop
Scalping
Crypto
Stocks
XAUUSD
NAS100
USDJPY
Über den cTrader Store verfügbare Produkte, einschließlich Handelsbots, Indikatoren und Plugins, werden von externen Entwicklern bereitgestellt und nur zu Informations- und technischen Zugriffszwecken verfügbar gemacht. cTrader Store ist kein Broker und erbringt keine Anlageberatung, persönlichen Empfehlungen oder eine Garantie für zukünftige Performance.
Mehr von diesem Autor


![„Wyckoff Toolkit [Iridio Capital]“-Logo](https://cdn.ctrader.com/image/webp/8acfe6a1-6a8e-4578-9367-9df3af2b1801_27763)


Preis
Seit 15/01/2025
7
Verkäufe