Description
Market Profile Indicator
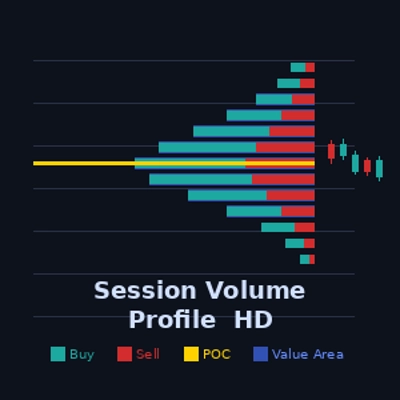
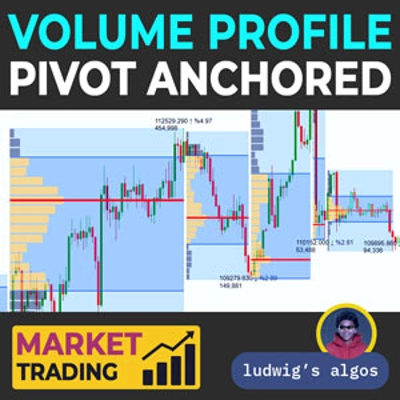
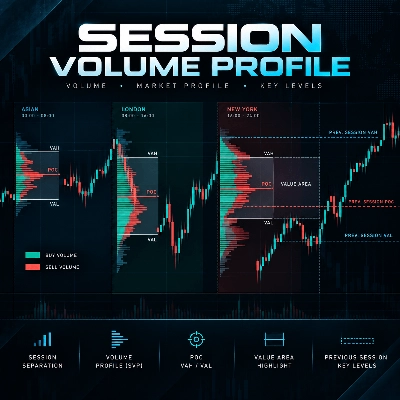
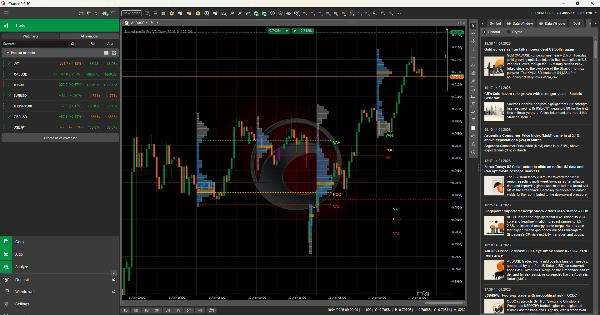
What it does Maps price distribution over time using TPO (Time Price Opportunity) blocks, revealing where the market spent the most time and where it rejected price.
Key Visual Elements — POC (Point of Control): highest volume/time price level — VAH / VAL: upper and lower Value Area boundaries (70% of activity) — Profile shape: bell curve = balanced; skewed = trending
Signals & Interpretation — Price above VAH = bullish breakout or fade opportunity — Price below VAL = bearish breakdown or reversal setup — POC acts as a magnet; price often rotates back to it — Thin profile zones = fast price movement, low acceptance
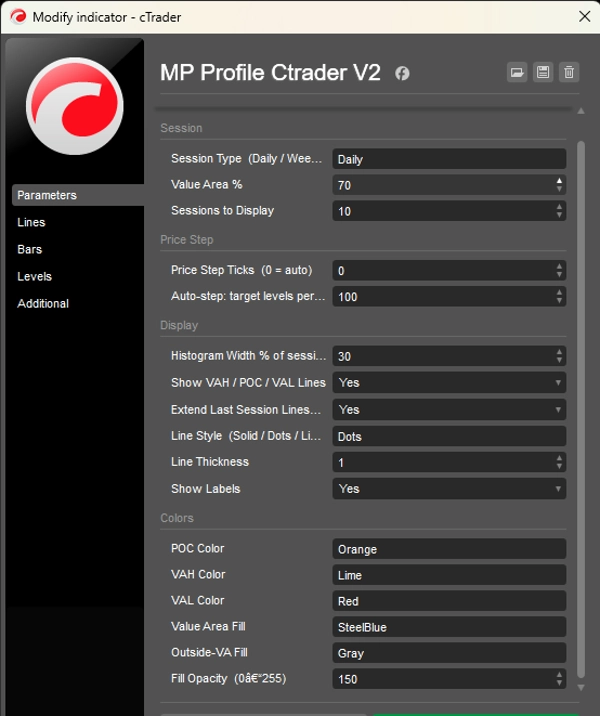
Key Settings — Session type: RTH / ETH / Weekly — Value Area %: default 70% — TPO block size: timeframe-dependent
Use Cases — Identify high-probability mean-reversion entries at VAH/VAL — Confirm trend breakouts when price escapes value area — Define intraday bias using overnight reference levels
Trader Profile Best suited for intermediate to advanced traders in futures, forex or equities using 15m–4H charts.
Limitations — Lagging by nature; always confirm with price action — Less effective in low-volume or news-driven sessions
Summary
The indicator provides signals for trading decisions: prices above VAH may indicate bullish breakouts or fade opportunities, while prices below VAL suggest bearish breakdowns or reversal setups. The POC often acts as a magnet, with price tending to rotate back to it. Thin profile zones correspond to rapid price movements with low acceptance.
Key settings include session type selection (Regular Trading Hours, Extended Trading Hours, or Weekly), adjustable Value Area percentage, and TPO block size based on timeframe. It is designed for intermediate to advanced traders using 15-minute to 4-hour charts across futures, forex, and equities markets. Use cases include identifying mean-reversion entries, confirming trend breakouts, and defining intraday bias with overnight reference levels. The indicator is volume-dependent and best used alongside price action confirmation.
Discussion
Customer reviews
5 | 0 % | |
4 | 100 % | |
3 | 0 % | |
2 | 0 % | |
1 | 0 % |