present
ลงทะเบียนและรับส่วนลด $50 สำหรับการซื้อครั้งแรกของคุณ
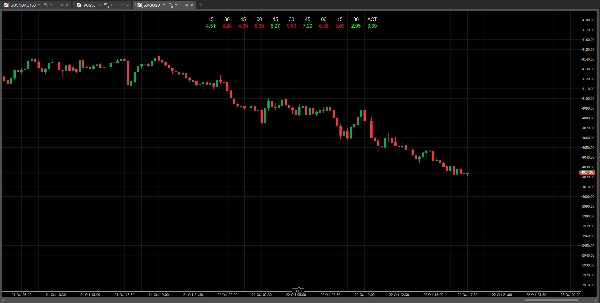
Trading product for Puntos de la Vela อินดิเคเตอร์ EMA Volume, image 1
Puntos de la Vela
อินดิเคเตอร์
เวอร์ชัน 1.0, Oct 2026
Windows, Mac
Trading product for Puntos de la Vela อินดิเคเตอร์ EMA Volume, image 2
Trading product for Puntos de la Vela อินดิเคเตอร์ EMA Volume, image 3
Trading product for Puntos de la Vela อินดิเคเตอร์ EMA Volume, image 4
ตั้งแต่ 05/09/2025
252.09M
ปริมาณการเทรด
5.82K
Pips ที่ได้กำไร
115
ติดตั้งฟรี

คำอธิบาย

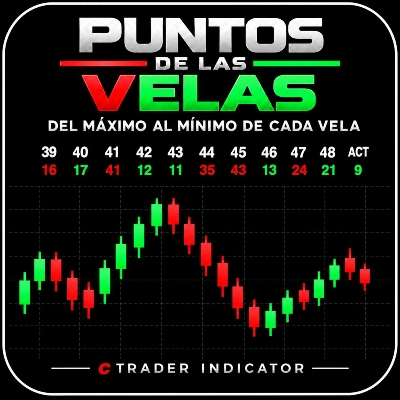
PUNTOS DE LAS VELAS es un indicador que muestra en tiempo real la cantidad de puntos recorridos por cada vela, midiendo la distancia entre su Máximo y Mínimo (High–Low).

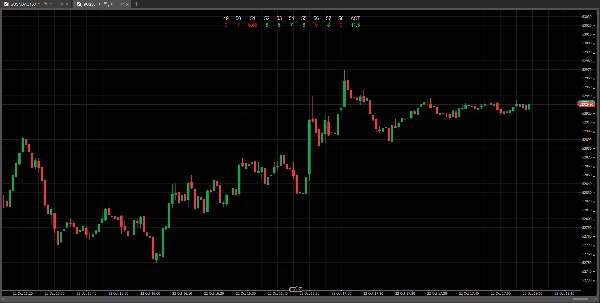
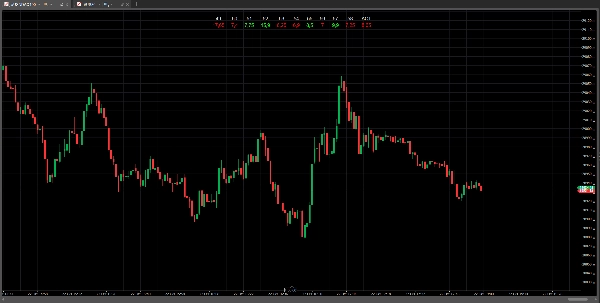
Permite visualizar los puntos de la vela actual (ACT) y de hasta 50 velas anteriores.

Permite identificar rápidamente qué velas tienen mayor o menor rango de puntos, facilitando el análisis de la volatilidad, el movimiento y la expansión del precio.

Los valores de las velas cerradas permanecen fijos, mientras que la vela actual (ACT) se encuentra en constante movimiento. Su valor se actualiza en tiempo real a medida que el precio alcanza nuevos máximos o mínimos, hasta que la vela finalmente se cierra.

Además, permite configurar el tamaño visual de los datos mostrados en pantalla, tanto de los puntos de cada vela como del minuto correspondiente a cada vela, adaptándose a las preferencias de visualización de cada Trader.


CANDLE POINTS is an indicator that shows in real time the number of points covered by each candle, measuring the distance between its High and Low.

It lets you see the points of the current candle (ACT) and up to 50 previous candles.

It helps you quickly identify which candles have a bigger or smaller point range, making it easier to analyze volatility, movement, and price expansion.

The values of closed candles remain fixed, while the current candle (ACT) is constantly changing. Its value updates in real time as the price reaches new highs or lows, until the candle finally closes.

Additionally, you can adjust the visual size of the data displayed on the screen, both for the points of each candle and the corresponding minute for each candle, adapting to each trader's viewing preferences.

สรุป

สรุปโดย AI
Puntos de la Vela is a real-time trading indicator that measures the point range between the High and Low of each candlestick, including the current one. It displays the point distance for the active candle (ACT) and up to 50 previous candles, enabling traders to quickly assess volatility, price movement, and expansion. Closed candle values remain fixed, while the current candle’s point range updates dynamically as new highs or lows are reached until the candle closes. The indicator also allows customization of the visual size of the displayed data, including both the point values and the corresponding time (minute) for each candle, accommodating individual trader preferences. This tool supports detailed analysis of price action by highlighting candles with larger or smaller ranges.
โปรไฟล์อินดิเคเตอร์

การสนทนา

รีวิวจากลูกค้า

0.0
รีวิว: 0
รีวิวจากลูกค้า
ยังไม่มีรีวิวสำหรับผลิตภัณฑ์นี้ หากเคยลองแล้ว ขอเชิญมาเป็นคนแรกที่บอกคนอื่น!

คำถามที่พบบ่อย

EMA
Volume
Support & Resistance
ผลิตภัณฑ์ที่มีให้บริการผ่าน cTrader Store รวมถึงบอทการเทรด อินดิเคเตอร์ และปลั๊กอิน มีให้บริการโดยนักพัฒนาบุคคลที่สามและมีไว้เพื่อวัตถุประสงค์ในการเข้าถึงข้อมูลและทางเทคนิคเท่านั้น cTrader Store ไม่ใช่โบรกเกอร์และไม่ได้ให้คำแนะนำการลงทุน คำแนะนำส่วนบุคคล หรือการรับประกันผลการดำเนินงานในอนาคต

เพิ่มเติมจากผู้เขียนคนนี้

อินดิเคเตอร์
ADX
Breaker Block
+1
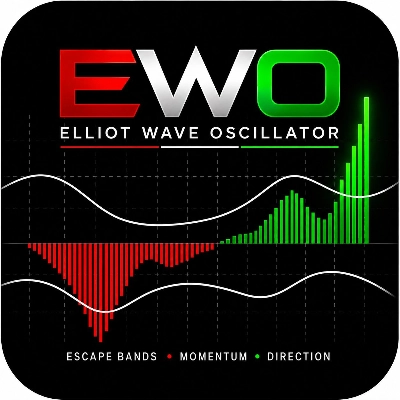
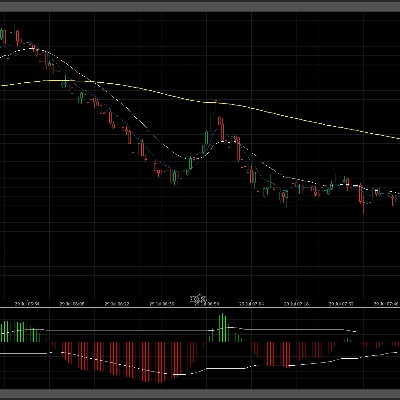
I share with you the Elliott Wave Oscillator. Hernan Nievas, Rosario, Argentina. April 28, 2026.
อินดิเคเตอร์
EMA
MACD
+1
The EWO is used to identify trading trends and opportunities in the financial markets.
อินดิเคเตอร์
EMA
Fibonacci
+1
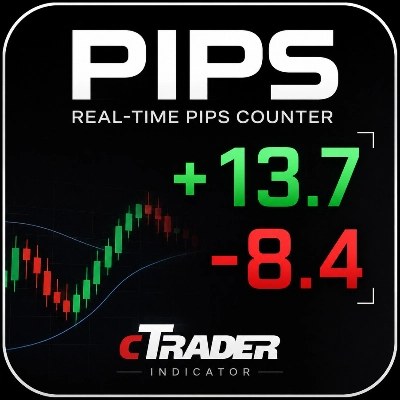
Shows the Pips of your open trade in real time with a clear and customizable display. Rosario, Argentina Julio 28, 2026.

นอกจากนี้คุณยังอาจชอบ

อินดิเคเตอร์
EMA
Volume
+4
Advanced volume‑profile tool with delta, HVN/LVN zones, and precise POC‑based trade signals.
"Institutional Flow Radar" โลโก้
ยอดนิยม
4.5
(4)
$19
/
$29
อินดิเคเตอร์
Breakout
Institutional Flow Radar scans the chart for abnormal volume events and classifies them into two groups: Capital &Public
อินดิเคเตอร์
ATR
Channel
Reversal Trap Probability Bands plots a dynamic volatility envelope around price & automatically detects "trap" reversal
"MACD Crossover PRO" โลโก้
ยอดนิยม
4.7
(4)
$19
/
$20
อินดิเคเตอร์
MACD
Prop
+14
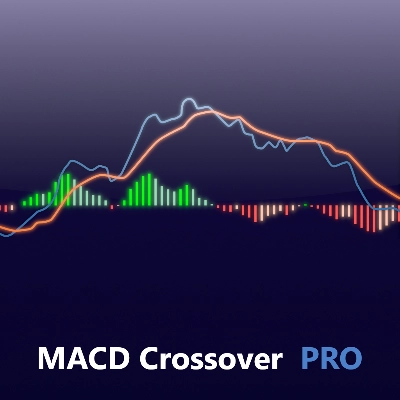
Customize the MACD! Choose colors, get real-time tick updates, and see crossover points for enhanced trading precision.
อินดิเคเตอร์
Volume
Moving Average
MULTI-TIMEFRAME ROLLING STANDARD DEVIATION TRADING SIGNAL - Smart Volatility Breakout System
อินดิเคเตอร์
ADX
ATR
+3
Get complete access to HAI Quantum V7 trial
อินดิเคเตอร์
BOS
CHOCH
+3
Identifies HH, HL, LH, and LL swing points using fractals. Essential for Smart Money Concepts and price action.
อินดิเคเตอร์
Forex
Indices
+5
Market Profile TPO for cTrader — full auction logic, IB, POC, VA zones, histogram and O/X markers with time
อินดิเคเตอร์
AI
Prop
+9
A cutting‑edge trading indicator that fuses AI and mathematics with adaptive logic to classify market regimes.
"CandleColourFlow_MultiFx" โลโก้
เรตติ้งสูง
4.4
(5)
$19
อินดิเคเตอร์
CandleColourFlow MultiFx - optimized to work on Fx Majors, Fx MInors, Fx Crosses
อินดิเคเตอร์
The Indicator is a powerful tool for price-action traders seeking to identify and exploit short-term imbalances.
อินดิเคเตอร์
MSS
Volume
+3
Rejection-based volume profile with tiered heat zones, POC levels and a fully draggable anchor on cTrader.
อินดิเคเตอร์
BOS
Volume
+5
The Volume Delta Indicator using Institutional Level 2 DOM Data, The Edge Institutions Pay Millions For, now on cTrader
อินดิเคเตอร์
ATR
Key Levels
+2
Detects real-time support and resistance levels with breakout signals, zones, and quality scoring for precise entries.
อินดิเคเตอร์
Drawdown Monitor
Protect your funded account. Real-time Daily Equity Drawdown monitor with Green / Orange / Red flashing alerts.
"RSI Advanced" โลโก้
เรตติ้งสูง
5.0
(4)
$20
/
$30
อินดิเคเตอร์
AI
ATR
+12
The standard Relative Strength Index (RSI), RSI & Signal Cloud, Smart Volatility Filter (ATR), On-Chart Info Dashboard
"RangePulsePro" โลโก้
ใหม่
5.0
(1)
$35
อินดิเคเตอร์
Risk Dashboard
AI-powered daily range forecasts help traders spot volatility opportunities and plan stops and targets.
"FVG Scanner" โลโก้
ใหม่
5.0
(1)
$25
อินดิเคเตอร์
Imbalance
Fair Value Gap
+1
Multi-symbol, multi-timeframe Fair Value Gaps in one panel.

ราคา

ตั้งแต่ 05/09/2025
252.09M
ปริมาณการเทรด
5.82K
Pips ที่ได้กำไร
115
ติดตั้งฟรี