Opis
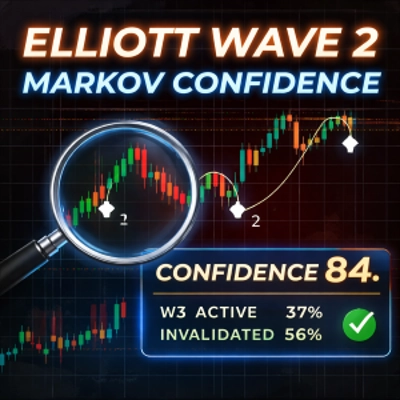
Elliott CLEAN — Wave2 + Markov Confidence
Elliott CLEAN to zaawansowany wskaźnik analityczny zaprojektowany, aby pomóc traderom identyfikować, weryfikować i zarządzać setupami Elliott Wave 2, wykorzystując kombinację struktury rynku oraz prawdopodobieństwa statystycznego.
Zamiast przewidywać kierunek ceny, wskaźnik koncentruje się na przejściach strukturalnych i odpowiada na bardziej użyteczne pytanie:
Jak prawdopodobne jest, że Fala 2 rozwinie się w ważną i trwałą Falę 3 — i jak duże powinno być zaufanie tradera do tego scenariusza?
Co robi ten wskaźnik
Elliott CLEAN automatycznie:
- Wykrywa struktury Fala 1–Fala 2 na podstawie punktów zwrotnych swing
- Definiuje wyzwalacz, stop-loss, unieważnienie oraz cele Fali 3
- Śledzi historyczne wyniki strukturalne za pomocą 5-stanowego modelu Markowa
- Oblicza warunkowe prawdopodobieństwa dla:
-
- Aktywacji Fali 3
- Unieważnienia setupu
- Wczesnego wyczerpania Fali 3
- Konwertuje te prawdopodobieństwa na pojedynczy Wskaźnik Zaufania (0–100)
Pozwala to traderom filtrować setupy niskiej jakości, unikać nadmiernego handlu i podejmować transakcje tylko wtedy, gdy struktura i statystyki się zgadzają.
Główne cechy
- ✅ Automatyczne wykrywanie Elliott Wave 2
- ✅ Wiele trybów potwierdzenia (Break+Hold, Break, Reclaim, Wick)
- ✅ Jasne wyzwalacze, stop-loss, unieważnienia i prognozowane cele
- ✅ Silnik prawdopodobieństwa Markowa 5-stanowy (oparty na zdarzeniach/swingach, nie na słupkach)
- ✅ Warunkowe prawdopodobieństwa w czasie rzeczywistym wyświetlane na wykresie
- ✅ Pojedynczy Wskaźnik Zaufania (0–100) wspierający decyzje
- ✅ Czysty, nieinwazyjny design HUD
- ✅ Działa na dowolnym symbolu i dowolnym interwale czasowym
Wskaźnik Zaufania (ważne)
Wskaźnik Zaufania to nie wskaźnik wygranych i nie sygnał.
Jest to kontekstowa miara jakości wyprowadzona z historycznych przejść strukturalnych:
- Podczas Fali 2, wskaźnik odzwierciedla:
-
- Prawdopodobieństwo rozpoczęcia Fali 3
- Skorygowane o prawdopodobieństwo wczesnej porażki
- Podczas Fali 3, wskaźnik odzwierciedla:
-
- Historyczne prawdopodobieństwo kontynuacji Fali 3 bez wczesnego wyczerpania
W praktyce:
- Niskie wyniki = struktura jest słaba lub niewiarygodna
- Wysokie wyniki = struktura jest rzadka, ale statystycznie solidna
Pomaga to traderom zdecydować kiedy zachować ostrożność, a kiedy pozwolić transakcji działać.
Typowe zastosowania
- ✔ Filtrowanie setupów Elliott Wave przed wejściem
- ✔ Unikanie marginalnych lub niskiej jakości transakcji Fali 2
- ✔ Dostosowywanie wielkości pozycji na podstawie zaufania
- ✔ Zarządzanie transakcjami Fali 3 z mniejszą emocjonalną ingerencją
- ✔ Wspieranie handlu dyskrecjonalnego za pomocą obiektywnych danych strukturalnych
Wskaźnik jest szczególnie przydatny dla traderów, którzy już rozumieją teorię Elliott Wave i chcą ilościowego potwierdzenia bez automatyzacji.
Jak używać (podstawowy przepływ pracy)
- Dołącz wskaźnik do wykresu
- Wybierz preferowany tryb potwierdzenia
- Poczekaj na ważną strukturę Fali 2
- Obserwuj:
-
- Wyzwalacz, stop-loss, unieważnienie
- Prawdopodobieństwa Markowa
- Wskaźnik Zaufania
- Zdecyduj, czy setup jest wart handlu na podstawie struktury + zaufania
Ważne uwagi i zastrzeżenia
- Ten wskaźnik jest analityczny, nie predykcyjny
- Nie generuje sygnałów kupna/sprzedaży
- Historyczne statystyki strukturalne nie gwarantują przyszłych wyników
- Trading wiąże się z ryzykiem; użytkownicy są w pełni odpowiedzialni za swoje decyzje
Wskaźnik jest przeznaczony jako narzędzie wspierające decyzje dla traderów dyskrecjonalnych.
Dla kogo jest ten wskaźnik
- Traderzy zaznajomieni z koncepcjami Elliott Wave
- Traderzy dyskrecjonalni, którzy cenią strukturę ponad wskaźniki
- Traderzy poszukujący obiektywnych filtrów, a nie systemów automatycznych
- Użytkownicy chcący kontekstu prawdopodobieństwa, a nie etykiet z retrospekcji
_______________________
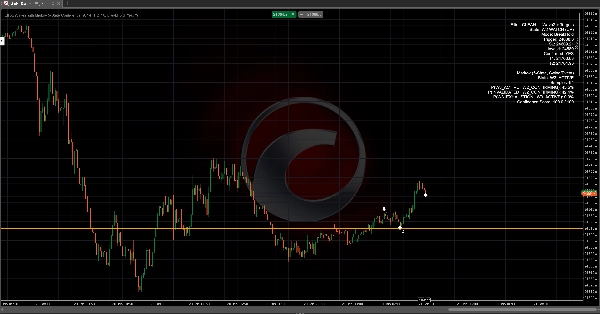
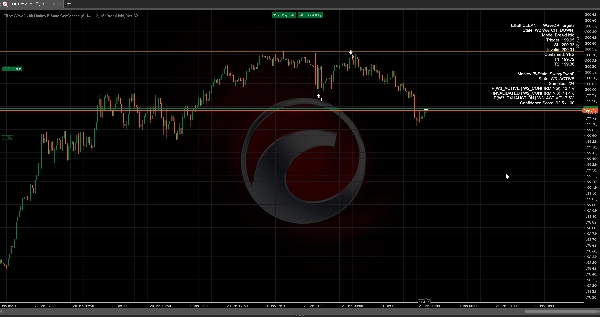
HUD i stany
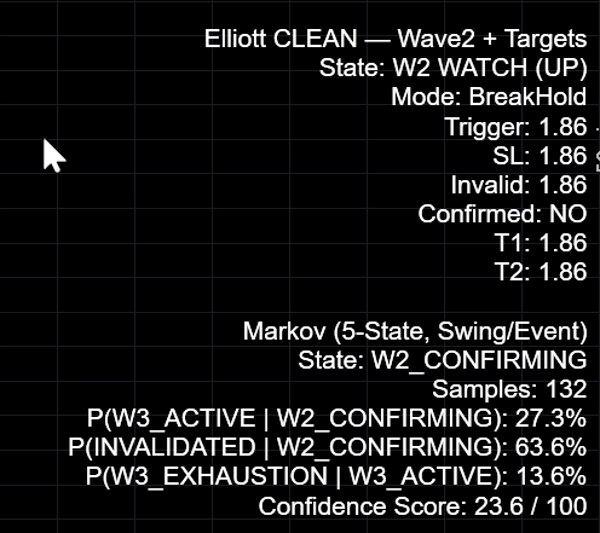
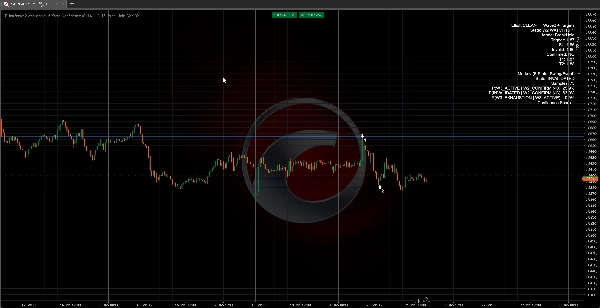
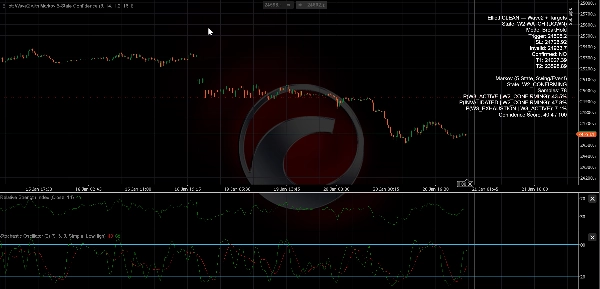
Wskaźnik wyświetla poziomy struktury i prawdopodobieństwa Markowa bezpośrednio na wykresie.
Główna warstwa Elliott:
- Stan: W2 WATCH (UP/DOWN) — potencjalna Fala 2 jest obecna (znaleziono strukturę)
- Potwierdzone: TAK/NIE — wybrana reguła potwierdzenia została wyzwolona
- Wyzwalacz — cena poziomu musi przełamać/odzyskać (zależy od trybu)
- SL — sugerowany poziom ochronnego stopu (zależy od trybu SL)
- Unieważnienie — poziom unieważnienia strukturalnego (początek Fali 1)
- T1/T2 — projekcje Fali 3 z użyciem mnożników
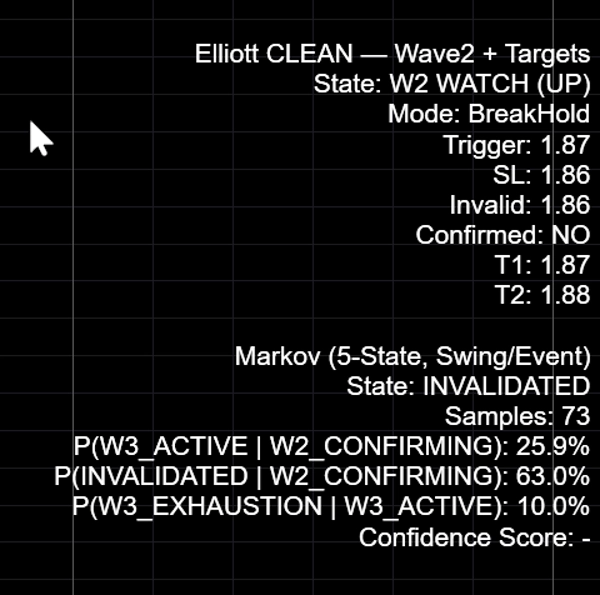
Warstwa Markowa:
- Stan — aktualny stan Markowa (np.
W2_CONFIRMING,W3_ACTIVE,INVALIDATED) - Próbki — liczba historyczna używana do obliczeń prawdopodobieństw
- P(W3_ACTIVE | W2_CONFIRMING) — szansa, że Fala 3 aktywuje się z fazy Fali 2
- P(INVALIDATED | W2_CONFIRMING) — szansa, że setup zawiedzie podczas fazy Fali 2
- P(W3_EXHAUSTION | W3_ACTIVE) — szansa, że Fala 3 zakończy się wcześnie po aktywacji
Wskaźnik Zaufania (0–100)
Wskaźnik Zaufania nie jest wskaźnikiem wygranych ani gwarancją. Jest to miara jakości wyprowadzona z historycznych przejść strukturalnych.
Jak używać wskaźnika:
- Podczas
W2_CONFIRMING, wskaźnik odzwierciedla „prawdopodobieństwo aktywacji” skorygowane o ryzyko wczesnej porażki. - Podczas
W3_ACTIVE, wskaźnik odzwierciedla „solidność kontynuacji” (niskie ryzyko wczesnego wyczerpania).
Zawsze interpretuj wskaźnik razem z: (1) jasnością struktury, (2) odległością unieważnienia oraz (3) wielkością próbki.
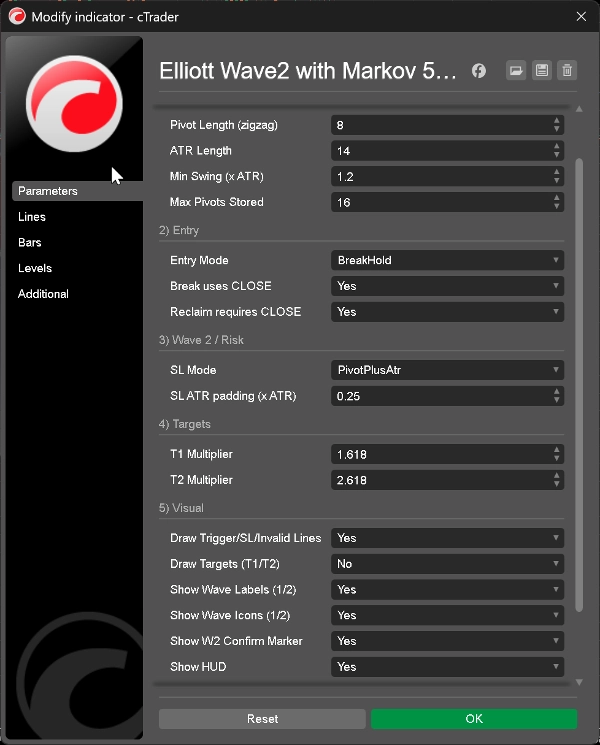
Parametry wejściowe (co robią)
1) Pivot / Struktura
- Długość Pivot (zigzag): Kontroluje czułość swingów. Wyższa = mniej swingów, czystsza struktura.
- Długość ATR: Okno ATR używane do filtrowania swingów i opcjonalnego buforu SL.
- Min Swing (×ATR): Minimalny rozmiar swingu do zaakceptowania pivotu (filtruje szumy).
- Maksymalna liczba przechowywanych pivotów: Ogranicza przechowywaną historię swingów (wydajność i stabilność).
2) Wejście
- Tryb wejścia: Wybierz styl potwierdzenia:
-
BreakHold— bezpieczniejszy: przełamanie, a następnie utrzymanie powyżej wyzwalaczaBreak— szybszy: jednokrotne przełamanie wyzwalaczaReclaim— zachowanie typu sweep + odzyskanieWick— agresywny: knot przebijający wyzwalacz
- Break używa ZAMKNIĘCIA: Używa ceny zamknięcia zamiast knota do logiki przełamania (zalecane).
- Reclaim wymaga ZAMKNIĘCIA: Wymaga zamknięcia po właściwej stronie po sweepie.
3) Fala 2 / Ryzyko
- Tryb SL: Określa bazę umiejscowienia stopa.
- Bufor SL ATR (×ATR): Dodatkowy margines przy użyciu stopa opartego na ATR.
4) Cele
5) Wizualizacja
- Rysuj linie Wyzwalacza/SL/Unieważnienia: Pokaż/ukryj główne poziomy poziome.
- Rysuj cele: Opcjonalne linie celów (mniej „czyste”).
- Pokaż etykiety / ikony fal: Wyświetl markery fal (1/2).
- Pokaż marker potwierdzenia W2: Pokazuje marker potwierdzenia.
- Pokaż HUD: Pokaż/ukryj cały HUD.
Jak używać:
- Skanuj wiele rynków, a następnie skup się tylko na środowiskach strukturalnych wyższej jakości.
- Używaj wskaźnika + wielkości próbki, aby zdecydować, kiedy setup jest wart czasu i ryzyka.
FAQ
Czy działa to na wszystkich symbolach i interwałach czasowych?
Tak. To podejście oparte na strukturze. Wyniki i prawdopodobieństwa będą się różnić w zależności od zachowania rynku i zmienności.
Czy Wskaźnik Zaufania to wskaźnik wygranych?
Nie. To wskaźnik jakości strukturalnej wyprowadzony z historycznych przejść stanów (model Markowa). Nie gwarantuje wyników.
Dlaczego wskaźnik jest często niski podczas Fali 2?
Ponieważ aktywacja Fali 3 jest selektywna. Wiele kandydatów na Falę 2 zawodzi lub oscyluje. Wskaźnik jest zaprojektowany, aby je odfiltrować.
A co z małą wielkością próbki?
Traktuj prawdopodobieństwa jako mniej stabilne, gdy wielkość próbki jest mała. Używaj wskaźnika jako kontekstu, nie pewności.
Zastrzeżenie dotyczące ryzyka
Trading wiąże się z ryzykiem i może nie być odpowiedni dla wszystkich inwestorów. Wyniki historyczne i prawdopodobieństwa nie gwarantują przyszłych rezultatów. Ten wskaźnik dostarcza wyłącznie informacji analitycznych i nie stanowi porady inwestycyjnej ani rekomendacji kupna lub sprzedaży jakiegokolwiek instrumentu. Jesteś odpowiedzialny za własne decyzje, zarządzanie ryzykiem oraz zgodność z lokalnymi przepisami.
Elliott Wave, Struktura Rynku, Analiza Techniczna, Prawdopodobieństwo, Analiza Statystyczna, Swing Trading, Zarządzanie Ryzykiem, Wsparcie Decyzji
Podsumowanie
Opinie klientów
5 | 100 % | |
4 | 0 % | |
3 | 0 % | |
2 | 0 % | |
1 | 0 % |


