

설명
거래에 참여하는 사람들은 이전 세션을 고려하는 것이 얼마나 중요한지 알고 있습니다.
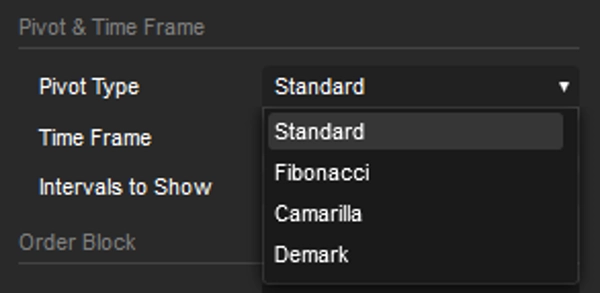
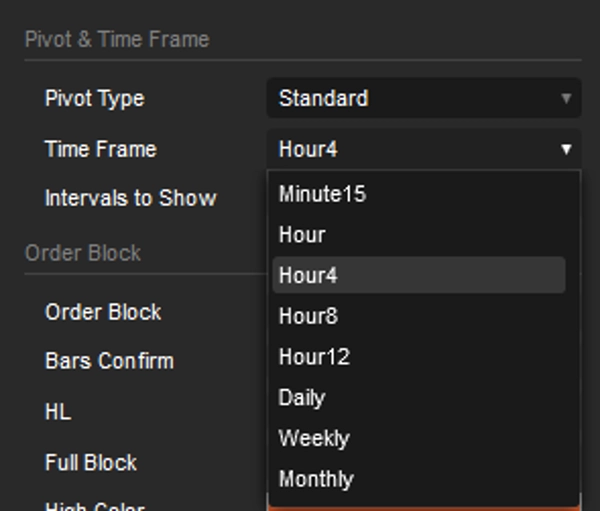
저는 15분부터 한 달까지의 간격을 가진 이 Pivot 지표를 준비했으며, 주문 블록과 추세선도 포함되어 있습니다. 두 옵션 모두 이전 세션의 최고점과 최저점을 기반으로 합니다.
기본 설정은 5분 타임프레임으로 설정되어 있습니다.
피벗은 4시간으로 설정되어 있고, 간격은 5로, 이는 4시간 간격으로 20시간을 되돌아본다는 의미입니다. 이는 일일 거래자에게 완벽합니다.
하지만 스윙 트레이딩을 선호한다면 피벗 간격만 변경하면 나머지는 자동으로 조정됩니다.
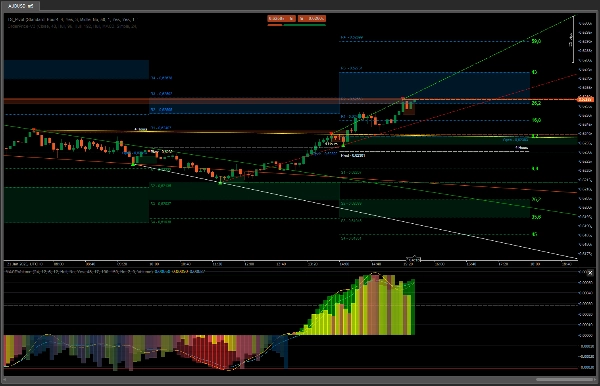
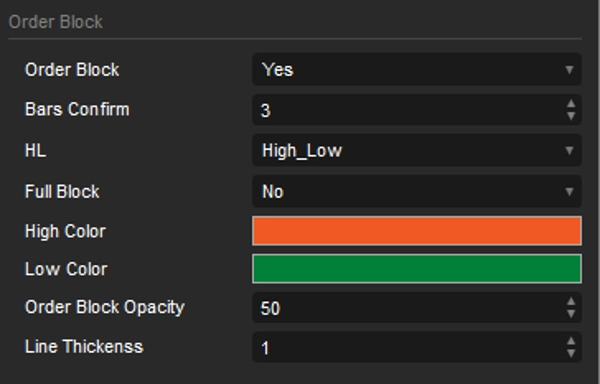
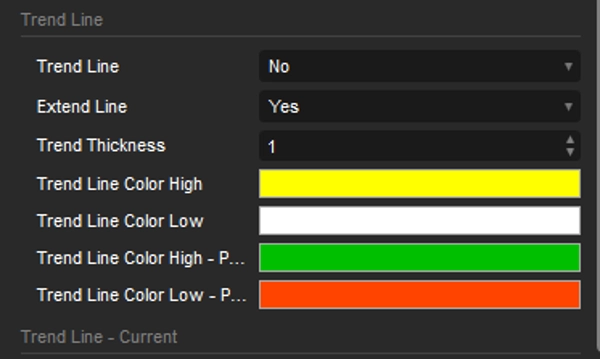
주문 블록은 가격이 지지 또는 저항을 찾을 수 있는 잠재적 영역을 강조하여 가능한 반전 또는 지속에 대한 통찰을 제공합니다. 선택한 타임프레임에 대해 자동으로 생성된 추세선과 결합함으로써, 트레이더는 잠재적 가격 방향과 진입 또는 종료 지점을 더 정확하게 식별할 수 있습니다. 여러 타임프레임에 걸쳐 이러한 추세선을 시각화할 수 있는 능력은 시장 구조에 대한 보다 완전한 이해를 제공합니다.
추가 도구와 함께
OrderPrice V3 https://ctrader.com/products/397
NTMPICLL https://ctrader.com/products/327
Range Box Level https://ctrader.com/products/245
Or RangeBoxFibonacci https://ctrader.com/products/526
Market Session https://ctrader.com/products/94
MacdVolume https://ctrader.com/products/267
4MA https://ctrader.com/products/247
당신은 무적이 될 것입니다
행운을 빕니다 😀
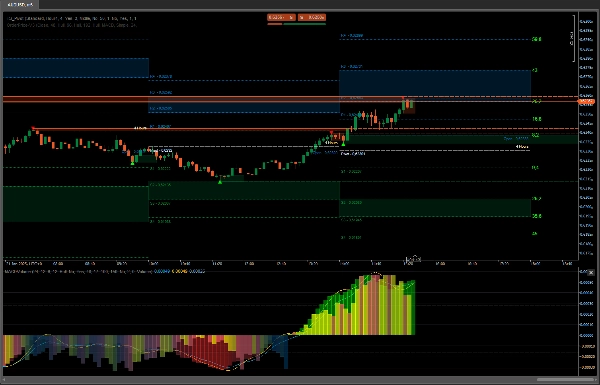
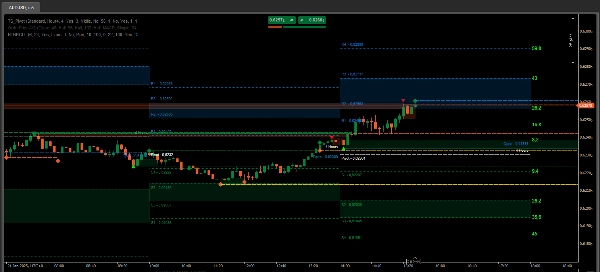
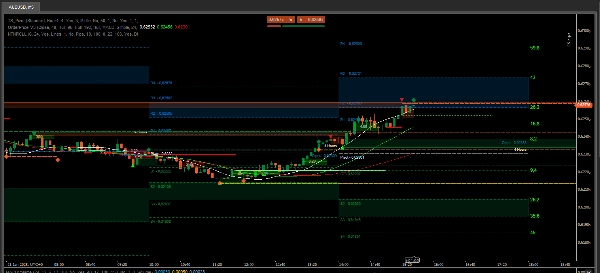
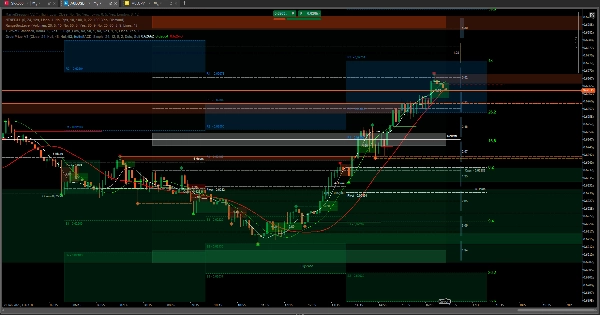
매수의 경우, 마지막 두 이미지에서 OrderPrice와 통합된 이동 평균의 동작을 관찰할 때, 녹색 선이 나타나고 이동 평균이 그 아래에 있을 때가 매수 거래를 열기에 완벽한 순간입니다.
이전 세션의 데이터를 통해 가격이 얼마나 멀리 갈 수 있는지 또는 저항이 어디에서 발생할 수 있는지 판단할 수 있습니다. 만약 돌파한다면, 두 번째 지점으로 계속될 수 있으며, 이는 RangeBoxLevel의 중립 구역일 수 있습니다. 그것을 넘어서고 이동 평균이 방향을 바꾸려는 징후가 없다면, 가격은 이전 세션의 주문 블록 구역에 도달할 수 있습니다.
마지막 이미지에는 거래에 진입하고 종료하기에 완벽한 상황의 스크린샷이 있습니다. 나머지는 단지 관찰하고 결론을 내리는 것입니다.
이 도구들은 자산 거래를 통해 승리하는 데 필수적입니다.
요약
Key features include the integration of order blocks and trend lines derived from previous session data. Order blocks identify potential support and resistance zones, aiding in spotting possible price reversals or continuations. The indicator automatically generates trend lines for the selected timeframe, helping traders assess market structure and potential price direction. Visualizing these trend lines across multiple timeframes enhances market analysis.
TS_Pivot can be used alongside complementary tools such as OrderPrice V3, NTMPICLL, Range Box Level, RangeBoxFibonacci, Market Session, MacdVolume, and 4MA to refine entry and exit decisions. By combining moving averages and order block signals, traders can identify optimal moments to open buy or sell positions. The indicator supports various markets including Forex, cryptocurrencies, commodities, indices, and stocks.
고객 리뷰
5 | 100 % | |
4 | 0 % | |
3 | 0 % | |
2 | 0 % | |
1 | 0 % |


