
Açıklama
Bu teknik analiz göstergesi, piyasa duyarlılığı, trend ve fiyat seviyeleri hakkında bilgi sağlar. Piyasa duyarlılığını hesaplamak için Hacim, Açık_Kapanış, Chaikin Volatilite ve Chaikin Para Akışı gibi verileri kullanır. Ayrıca spreadleri ayarlamanıza, trendleri tespit etmenize ve fiyat seviyeleri ile pipleri görselleştirmenize olanak tanır. Piyasadaki baskın gücü belirlemek, fiyat hareketlerini öngörmek ve ticaret kararlarını iyileştirmek için faydalı bir araçtır.
Açıklamada önemli parametreleri belirtirim; geri kalanlar renk, çizgi tipi ve yazı tipi boyutu gibi stil yapılandırmalarıdır.
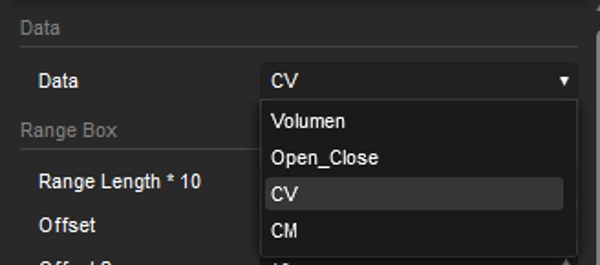
Veri
Duyarlılık hesaplamaları, Hacim, Açık_Kapanış, Chaikin Volatilite ve Chaikin Para Akışı arasından seçim yapılarak yapılır.
Aralık Uzunluğu * 10
Değer, hesaplamanın dayandığı mum (dönem) sayısını gösterir – değer 10 ile çarpılır.
Yakınlaştırma Ekle
Grafiğin merkezde kalmasını sağlar, ayrıca konsolidasyon ve trend değişiklikleri gibi durumları dikkate almaya yardımcı olur.
Marjin
Görselleştirmeyi iyileştirmek için üst ve alt marjinleri ayarlamaya olanak tanır.
Duyarlılığı Göster
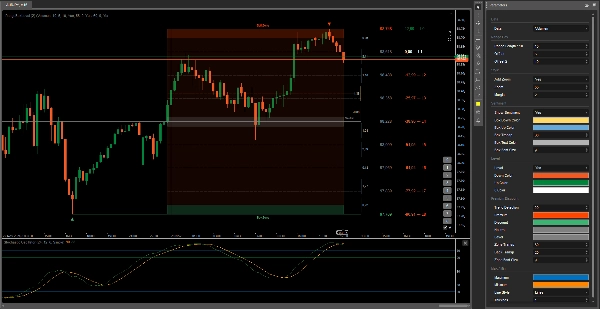
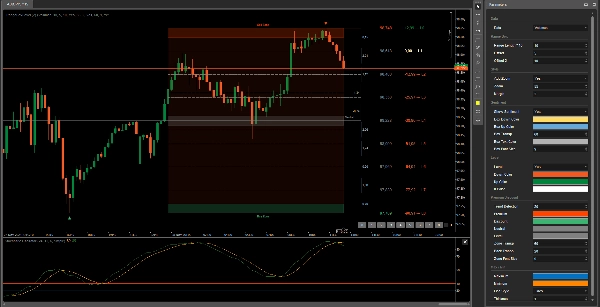
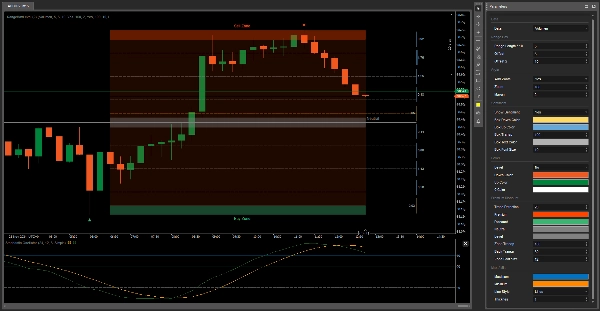
Duyarlılık, piyasada o anda hangi gücün daha güçlü olduğunu gösterir. Sarı çubuklar büyürse, daha fazla satıcı olduğu anlamına gelir ve tam tersi. Duyarlılık görselleştirmesini görmek istemiyorsanız, sağ tarafta gizleyebilirsiniz.
Seviye
Bu, her seviyedeki fiyatlar ve pipler için referans olarak kullanılabilecek ekstra bir özelliktir. Alış emrini yerleştirmek istediğiniz bir seviye seçtiğinizde, fiyatın ulaşabileceği her seviyedeki pipleri gösterir.
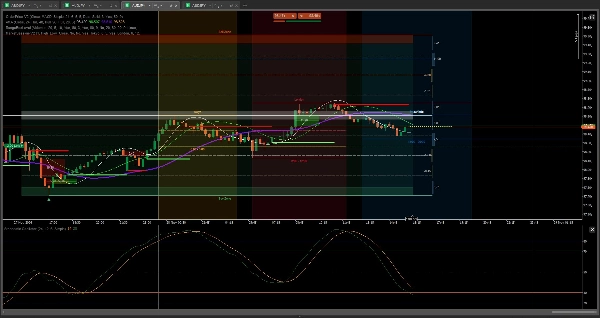
Trend Tespiti
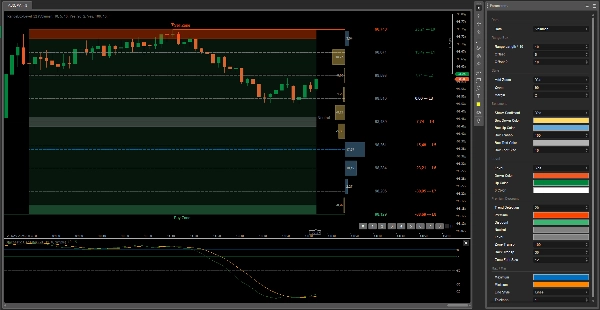
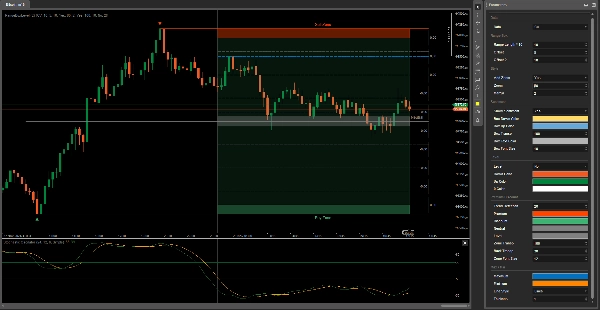
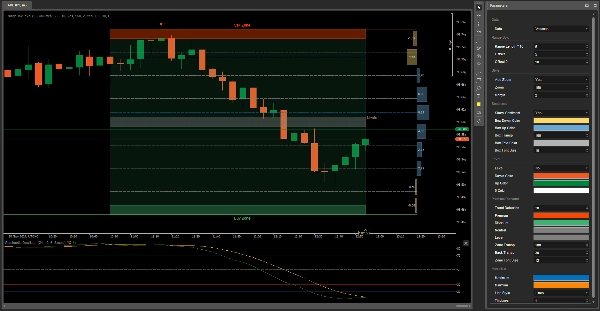
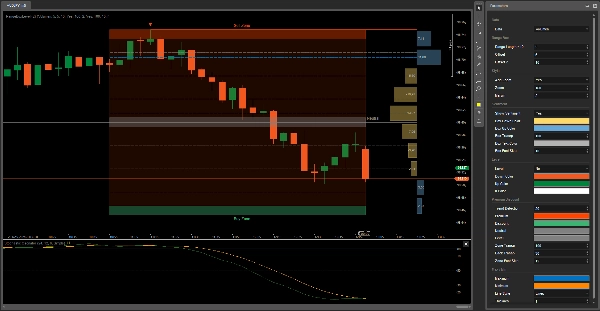
Varlığın trendine bağlı olarak, Aralık Kutusu'nun arka planı değişir: yükseliş trendindeyse yeşil, düşüş trendindeyse kırmızı olur.
Maks / Min
Bunlar, fiyatın nereye gidebileceği tahminine göre konumları değişen mavi ve sarı çizgilerdir. Aralık Kutusu, fiyat dönüş noktalarını belirlemeye yardımcı olmak için 9 bölüme ayrılmıştır ve Fibonacci Düzeltmesi olarak hizmet eder.
Yenilmez olacaksınız
İyi şanslar 😀
Özet
Key features include sentiment visualization with bars indicating the dominance of buyers or sellers, trend detection through background color changes (green for bullish, red for bearish), and level indicators that display potential price and pip targets for placing orders. The Range Box is divided into nine sections to identify price inflection points, functioning similarly to Fibonacci retracement levels, with dynamic max/min lines predicting possible price movements.
This tool supports analysis across various markets including stocks, cryptocurrencies, indices like NAS100, and commodities such as XAUUSD (gold). It is suitable for trading strategies like scalping and grid trading and can assist traders in anticipating price movements and making informed decisions. The indicator integrates with additional tools for enhanced order price management and market session analysis.
Müşteri değerlendirmeleri
5 | 100 % | |
4 | 0 % | |
3 | 0 % | |
2 | 0 % | |
1 | 0 % |


