
Açıklama
Market Structure Pro – Trend Çizgileri, Bölgeler ve Akıllı Girişler
Market Structure Pro, piyasanın salınım yapısını, ana destek/direnç noktalarını, gerçek trend çizgilerini ve HH/LL bölgelerini otomatik olarak haritalayan eksiksiz bir fiyat hareketi araç setidir—dahili onay mantığı ile yüksek olasılıklı geri çekilme girişlerini isteğe bağlı olarak vurgular.
Her şeyi elle çizmek yerine, gösterge arka planda sürekli olarak grafiğinizi tarar ve yapınızı, bölgelerinizi ve sinyallerinizi gerçek zamanlı olarak güncel tutar.
Bu gösterge ne yapar
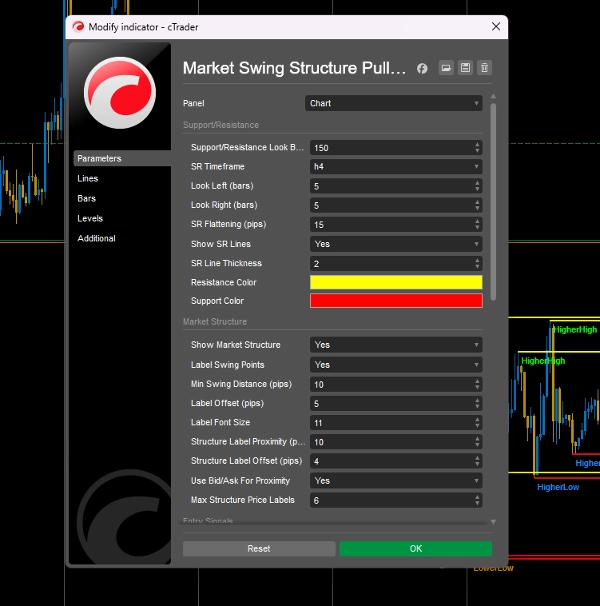
- Otomatik Destek ve Direnç
-
- Yapıdaki yüksek/düşük noktaları yapılandırılabilir bir geriye dönük aralıkta tespit eder.
- Yakındaki seviyeleri pip toleransı kullanarak daha temiz bölgelere düzleştirir.
- Seçilen herhangi bir zaman diliminde etkileşimli SR çizgileri çizer (örneğin, M15 girişlerinde 4H SR).
- Destek ve direnç için tamamen özelleştirilebilir kalınlık ve renkler.
- Gerçek Dış Trend Çizgileri
-
- Doğrulanmış salınım noktalarından yükselen/alçalan destek ve direnç trend çizgileri oluşturur.
- Gösterilen yön başına kaç trend çizgisi olacağını ve bunların geleceğe uzatılmasını kontrol eder.
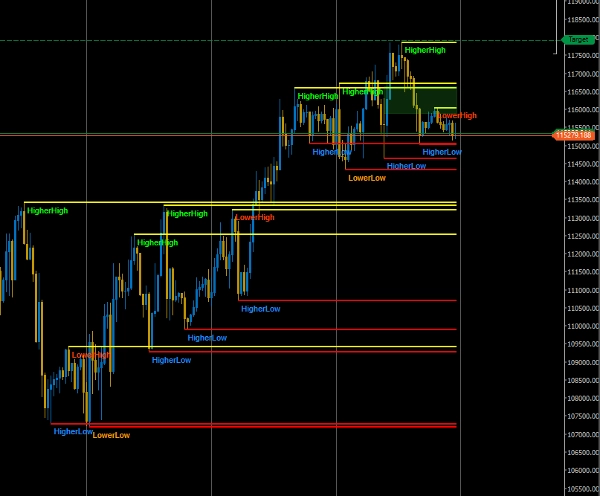
- Piyasa Yapısı Haritalaması (HH, HL, LH, LL)
-
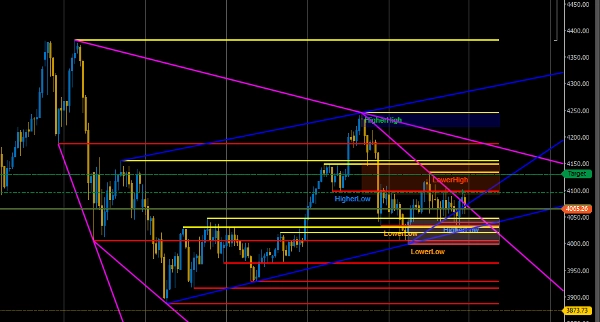
- Grafikte doğrudan Daha Yüksek Yüksek, Daha Yüksek Düşük, Daha Düşük Yüksek, Daha Düşük Düşük salınımlarını etiketler.
- Piyasa gürültüsünü kaldırmak için ayarlanabilir minimum salınım mesafesi (pip).
- Grafiğinizin temiz kalması için aktif etiket sayısını sınırlar.
- Canlı metin ile “Mevcut Trend” (Yükselen Trend / Düşen Trend / Yanlamasına, dönüş notları ile) gösterir.
- Yönsel bağlam sağlamak için dahili “Sonraki Yapı Tahmini” mesajı.
- HH/LL Kaynak Mum Bölgeleri
-
- Son Daha Yüksek Yüksek ve Daha Düşük Düşük kaynak mumlarından otomatik olarak bölgeler çizer.
- Üç bölge modu:
-
- Tam Mum (yüksek ↔ düşük)
- Sadece Gövde (açılış/kapanış aralığı)
- Sadece Fitil (HH için üst fitil, LL için alt fitil)
- Bölge dolgusu (pip), opaklık, uzun/kısa bölgeler için renk ve bölgeleri mevcut bara uzatma seçeneği.
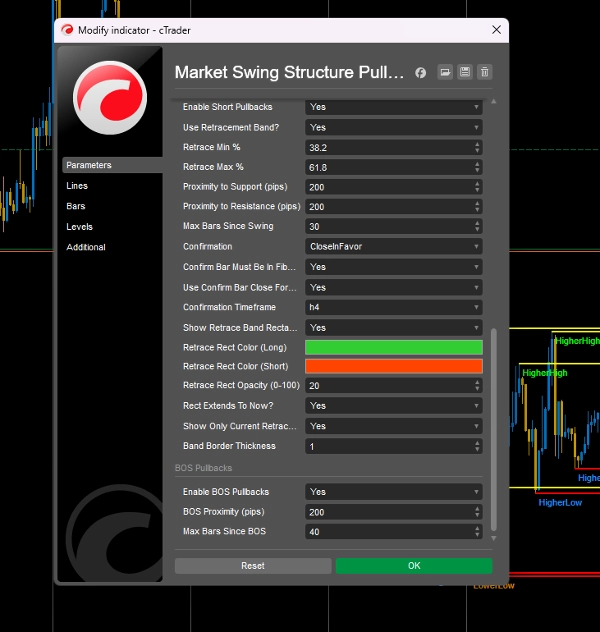
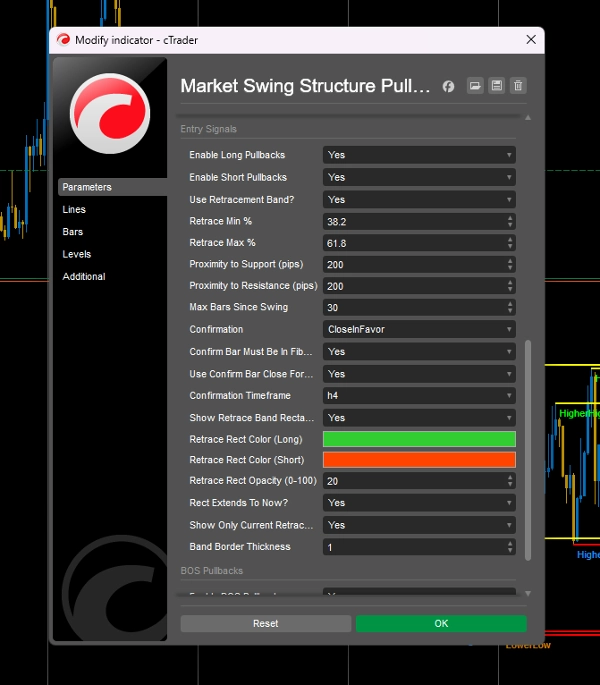
- Akıllı Giriş Sinyalleri (isteğe bağlı)
-
- Tüm giriş sinyallerini açıp kapatmak için ana anahtar.
- Salınım geri çekilme girişleri:
-
- En son impuls bacağını kullanır (HH–HL veya LH–LL).
- Alım/satımlar için Fibonacci tarzı geri çekilme bandı oluşturur (örneğin 38.2–61.8%).
- Salınım noktalarına ve SR seviyelerine yakınlığı kontrol eder.
- Bir sinyalin hala geçerli olduğu salınımdan sonraki bar sayısını sınırlar.
- Yapı Kırılması (BOS) geri çekilmeleri:
-
- Ana LH/HL kırılmalarıyla BOS tespit eder.
- BOS seviyesi ve yakın SR için retest arar.
- Ayrı yakınlık ve “BOS’dan beri barlar” filtreleri kullanır.
- Onay Motoru
-
- Girişler için birden fazla onay modu:
-
- Sadece lehine kapanış
- Sadece yutan mum
- Kapanış + Yutan Mum
- Hiçbiri (ham sinyaller)
- Onay mumunun ayrıca geri çekilme bandı içinde olması gerektiği isteğe bağlı şartı.
- Ayrı onay zaman dilimi (örneğin M15 işlem yaparken H4’te onaylama).
- Onay bar kapanışını gerçek sinyal fiyatı/zamanı olarak kullanmayı seçebilirsiniz.
- Görsel ve Performans Kontrolleri
-
- Ayarlanabilir etiket ofsetleri, yazı tipi boyutu ve maksimum yapı etiketi sayısı.
- Geri çekilme bantları ve bölgeler için dikdörtgen opaklığı, sınır kalınlığı ve “şimdiye uzat” davranışı.
- Daha düşük zaman dilimlerinde bile hesaplamaları verimli tutmak için zamanlayıcı tabanlı güncellemeler.
İdeal olan
- Piyasa yapısına (HH/HL/LH/LL) güvenen fiyat hareketi traderları.
- Giriş grafiklerinde daha yüksek zaman dilimi SR ve trend çizgilerinin görünmesini isteyen salınım ve günlük içi traderlar.
- Ana yapı, bölgeler ve BOS seviyeleri etrafında kural tabanlı geri çekilme girişleri arayan ve net onaylar isteyen traderlar.
Nasıl kullanılır
- SR zaman diliminizi seçin (örneğin H4) ve geriye dönük aralığı belirleyin.
- Trend Çizgilerini etkinleştirin ve bunların uzatılıp hafta sonu boşlukları için filtrelenip filtrelenmeyeceğini ayarlayın.
- Piyasa Yapısını ve etiketleri açarak HH/HL/LH/LL ile canlı trend/tahmini görün.
- Bölgeleri etkinleştirin ve tercih ettiğiniz aralık modunu seçin (Tam, Gövde veya Sadece Fitil).
- Sinyaller istiyorsanız, Giriş Sinyallerini açın, geri çekilme bandınızı (örneğin 38.2–61.8%), yakınlıkları ve onay davranışını ayarlayın.
Risk yönetimi ve yürütme kontrolü hala sizde – Market Structure Pro size çizim yapmaya değil karar vermeye odaklanmanız için yapılandırılmış, görsel bir çerçeve sunar.
Özet
It features auto-drawn zones based on the last Higher High and Lower Low source candles, with options for full candle, body only, or wick-only ranges. Smart entry signals include swing pullback entries using Fibonacci-style retracement bands and break-of-structure (BOS) pullbacks, both filtered by proximity and time since the swing or BOS event. A confirmation engine supports multiple modes such as close-in-favor, engulfing candles, or combined confirmations, with configurable confirmation timeframes and signal price options.
Visual and performance controls allow adjustment of label offsets, font sizes, opacity, and update frequency to maintain chart clarity and efficiency. Market Structure Pro supports various markets including Forex, indices, commodities, stocks, and cryptocurrencies, and is suitable for price-action, swing, and intraday traders seeking structured, rule-based analysis and entry signals without manual drawing.
Müşteri değerlendirmeleri
5 | 33 % | |
4 | 67 % | |
3 | 0 % | |
2 | 0 % | |
1 | 0 % |


