
Açıklama
🔍 Belirli bir tarihsel dönemdeki hacim verilerini inceler, yüksek kaldıraçlı yatırımcıların tasfiyeye uğrayabileceği potansiyel alanları vurgular ve piyasa davranışı hakkında değerli bilgiler sunar.
Bu gösterge ne yapar?
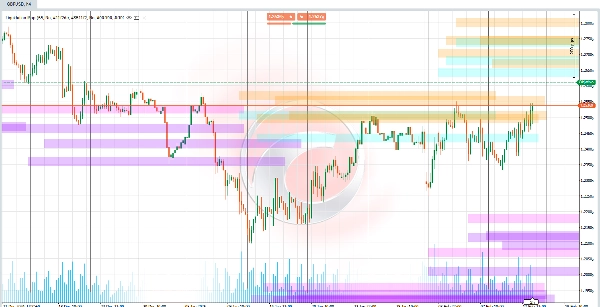
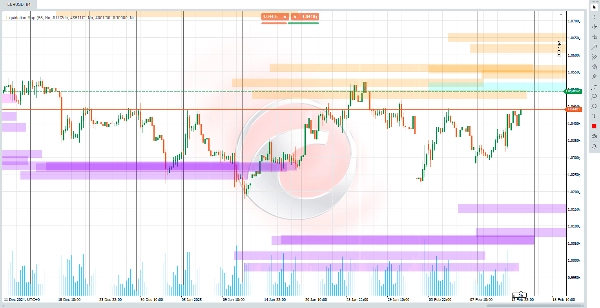
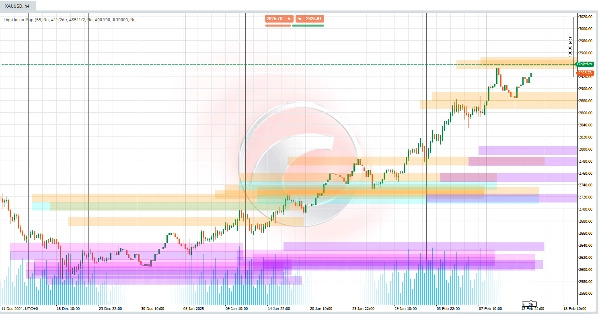
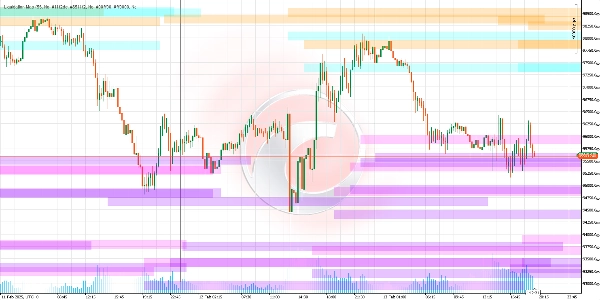
Bu algoritma, kaldıraçlı pozisyonların (örneğin 5x, 10x, 25x, 50x veya 100x) büyük tasfiyelerinin muhtemel olduğu fiyat seviyelerini belirler. Bu seviyeler, tasfiyelerin keskin piyasa dalgalanmalarını tetikleyebileceği için fiyat hareketleri için "mıknatıs" görevi görür. Gösterge, bu eşikleri temsil eden yatay çizgileri grafik üzerinde çizer ve gelecekteki önemli ilgi alanlarını tahmin etmek için bu çizgileri projekte eder.
Bu seviyeler nasıl hesaplanır?
- Fiyat Dönüş Noktası Tespiti:
🔄 Grafikteki son yüksek ve düşük noktaları (fiyatın yön değiştirdiği noktalar) belirler. Bu dönüş noktaları, tasfiye seviyelerinin hesaplanmasının temelini oluşturur. - Tetikleyici Olarak Hacim:
📊 Mevcut hacmi tarihsel ortalama ile karşılaştırır. Hacim belirli eşikleri aşarsa (örneğin 100x için ortalamanın 1.2 katı), ilgili tasfiye seviyeleri aktif hale gelir. - Tasfiye Formülü:
Kaldıraç ne kadar yüksekse, tasfiye seviyesi mevcut fiyata o kadar yakın olur. -
- Uzun pozisyonlar için : Tasfiye seviyesi, kaldıraç baz alınarak hesaplanan dönüş düşük seviyesinin altında (örneğin 50x için %2 altında) ayarlanır.
- Kısa pozisyonlar için : Seviye, aynı prensip kullanılarak dönüş yüksek seviyesinin üstünde ayarlanır.
Kullanırken ne bekleyebilirsiniz?
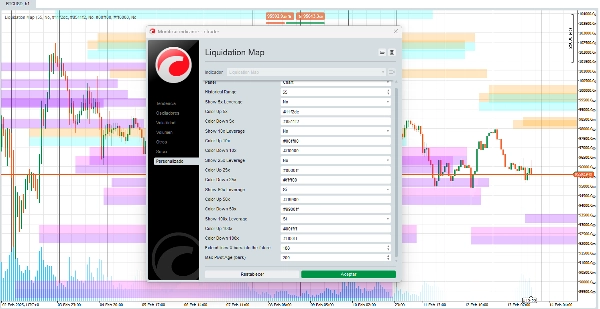
- Likidite Çizgileri: 🎨 Tasfiyeler nedeniyle piyasanın yüksek volatilite yaşayabileceği bölgeleri temsil eden özelleştirilebilir yatay çizgiler görürsünüz.
- Konfigüre Edilebilir Kaldıraçlar: ⚙️ Her kaldıraç türü için seviyeleri etkinleştirebilir/devre dışı bırakabilirsiniz (örneğin sadece 50x ve 100x'e odaklanmak).
- Renk Özelleştirme: 🌈 Her tasfiye aralığı için renk seçebilir, görselleştirmeyi tercihinize göre uyarlayabilirsiniz.
- Yoğunluk Bölgeleri: 🎯 Birbirine yakın birden fazla çizgi, aynı anda birden fazla tasfiye olabileceği yüksek risk/yüksek ödül alanlarını gösterir.
Sinyalleri nasıl yorumlamalı?
- Fiyat Bir Çizgiye Yaklaşıyor: 🚨 Fiyat bir tasfiye seviyesine yaklaşırsa (özellikle yüksek hacimle), keskin bir hareket olasılığı artar.
- Renk ve Şeffaflık: 🎨 Renkler kaldıraçlara göre değişir (örneğin 25x için mavi, 50x için turuncu). Şeffaflık, ilişkili hacmin "gücünü" gösterir (daha koyu çizgiler = daha önemli hacim).
Neden faydalıdır?
- Proaktif Tahmin: 🔮 Sadece geçmişi analiz etmekle kalmaz; mevcut koşullara göre gelecekteki seviyeleri projekte eder.
- Piyasa Psikolojisine Odaklanma: 🧠 Zorunlu tasfiyeler genellikle zincirleme reaksiyonlar yaratır (örneğin, stop-loss emirleri daha fazla satış tetikler). Bu gösterge bunları önceden görmenize yardımcı olur.
- Özelleştirme: 🛠️ Görselleştirmeyi stratejinize göre uyarlayın (örneğin, volatil piyasalarda daha yüksek kaldıraçlara öncelik verin).
Dikkate alınması gereken sınırlamalar
- Hacim Bağımlılığı: 📉 Hacim düşükse veya tarihsel veri yetersizse, sinyaller daha az güvenilir olabilir.
- Kristal Küre Değil: 🔮 Seviyeler olası bölgeleri gösterir, kesinlikleri değil. Her zaman diğer analizlerle birleştirin.
- Dinamik Ortam: 🌍 Beklenmedik haberlerin olduğu piyasalarda tasfiyeler projekte edilen seviyelerin dışında gerçekleşebilir.
Ctrader Store göstergeleri:
Dynamic Market Structure
Analysis of Turning Points
Fibonacci Linear
Regression Multi-timeframe
Multi-Level Candle Bias
Tracker
Auto Support and
Resistance Trend Lines
Özet
Müşteri değerlendirmeleri
5 | 67 % | |
4 | 0 % | |
3 | 33 % | |
2 | 0 % | |
1 | 0 % |


!["[Stellar Strategies] Smart ADX" logosu](https://cdn.ctrader.com/image/webp/af13b084-b6f6-41db-b7bc-c7e688b57b05_36929)


