Açıklama
Pinescriptlabs Store göstergeleri: Pinescriptlabs Store cBotları : (cBot) Gold & BTC BreakoutOturum Pivotları(yeni)
FİYAT HAREKETİ (Yeni)
SmartTrend Destek &
Direnç
Çizgileri
Dinamik
Piyasa Yapısı
Analizi
Dönüş
Noktaları
Analizi
Fibonacci
Doğrusal
Regresyon
Çoklu Zaman Dilimi
Çok Katmanlı
Mum Eğilimi
Takipçisi
Otomatik
Destek ve
Direnç
Trend
Çizgileri
Tüm
Destek ve
Direnç
Düzeyleri
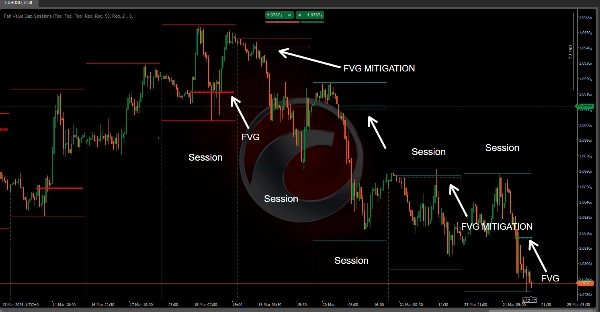
Adil Değer Boşluğu Oturumları 📊💰
Adil Değer Boşluğu (FVG) göstergesi, belirli işlem oturumları içinde "adil değer boşlukları" olarak bilinen geçici piyasa verimsizliklerini tanımlamak ve vurgulamak için tasarlanmış gelişmiş bir ticaret aracıdır 🚨. Bu boşluklar, piyasa fiyatının hızlı hareket ettiği ⚡ ve alıcılar ile satıcılar arasında dengesizlik yarattığı anları temsil eder.
Temel Teknik Mekanizmalar 🔧
Oturum Tabanlı Mimari 🕒
• Hassas, yapılandırılabilir oturum tabanlı analiz yaklaşımı uygular
• Tüccarların UTC veya yerel saat dilimi desteği ile özel oturum başlangıç zamanlarını tanımlamasına olanak tanır 🌍
• Piyasa davranışını sıfırlayan ve izleyen dinamik bir oturum sınırı oluşturur 🔄
Adil Değer Boşluğu Tespit Mantığı 🔎
• Birden fazla ardışık fiyat çubuğu boyunca gelişmiş fiyat hareketi analizi kullanır
• Boşlukları karşılaştırarak tanımlar:
o Ardışık çubukların yüksek ve düşük fiyatları 📈📉
o Önceki çubuğun kapanış fiyatı ✅
o Mevcut çubuğun fiyat yapısı 🔄
Boşluk Sınıflandırması 🏷️
Gösterge iki ana boşluk türünü ayırt eder:
- Boğa Adil Değer Boşluğu 📈
o Fiyat önceki yüksek seviyenin üzerine çıktığında oluşur 🔺
o Potansiyel yukarı yönlü piyasa momentumu gösterir 🚀
o Olası alım baskısını işaret eder 💸 - Ayı Adil Değer Boşluğu 📉
o Fiyat önceki düşük seviyenin altına düştüğünde oluşur 🔻
o Potansiyel aşağı yönlü piyasa momentumu önerir ⬇️
o Olası satış baskısını işaret eder 🛑
Ticaret Uygulamaları 📱💼
Stratejik İçgörüler 💡
• Tüccarların piyasa verimsizliklerini görselleştirmesine yardımcı olur 🖼️
• Potansiyel trend dönüşlerinin erken uyarısını sağlar ⚠️
• Kesin giriş ve çıkış noktası tanımlaması sunar 🎯
Risk Yönetimi Özellikleri 🛡️
• Boşluk durumlarının renk kodlu görselleştirmesi 🎨
• Boşluk "azaltımını" (fiyatın boşluk bölgesine geri dönmesi) izler ↔️
• Farklı piyasa koşulları için özelleştirilebilir renk ayarlarına izin verir 🎨
Teknik Görselleştirme 🎨
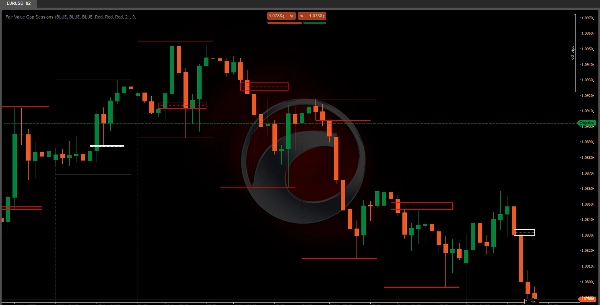
Gösterge iki ana görsel öğe oluşturur:
- Boşluk Alanı Dikdörtgeni 🟩
o Tanımlanan boşluğun fiyat aralığını temsil eder 📐
o İşlem oturumu boyunca dinamik olarak genişler ➡️
o Boşluk durumuna göre renk değiştirir (aktif/azaltılmış) 🟩➡️🟨 - Seviye Çizgisi 📏
o Boşluğun orta noktasına konumlandırılmıştır ⚫
o Tüccarların boşluğun merkezi fiyat bölgesini hızlıca tanımlamasına yardımcı olur 📍
o Boşluk durumunu göstermek için farklı çizgi stilleri kullanır ➔
Pratik Ticaret Stratejileri 📝
Giriş Sinyali Stratejileri 🚦
• Boşluk tespitini potansiyel bir trend devam sinyali olarak kullanın 🔄
• Onay için fiyatın boşluğa geri dönmesini (azaltmasını) bekleyin ✅
• Sağlam karar vermek için diğer teknik göstergelerle birleştirin 🤝
Risk Yönetimi Teknikleri 🛡️
• Boşluk sınırlarına yakın stop-loss belirleyin ⛔
• Potansiyel destek/direnç seviyesi olarak boşluk orta noktasını kullanın 🪜
• Potansiyel trend dönüş göstergesi olarak boşluk azaltımını izleyin ↔️⚠️
Yapılandırma Esnekliği ⚙️
• Özelleştirilebilir oturum başlangıç zamanı ⏰
• Saat dilimi yapılandırması (UTC/Yerel) 🌍
Adil Değer Boşluğu Oturumları göstergesini anlayarak ve doğru şekilde uygulayarak, tüccarlar piyasa dinamiklerine daha derinlemesine hakim olabilir, potansiyel ticaret fırsatlarını tanımlayabilir ve fiyat hareketi verimsizliklerine dayalı daha bilinçli kararlar verebilirler. 🧠📈
Özet
It classifies gaps into two types: bullish gaps, indicating potential upward momentum and buying pressure, and bearish gaps, signaling possible downward momentum and selling pressure. Visually, it represents gaps with dynamic rectangles showing the price range and a midpoint level line to help traders quickly locate the gap's central price zone. Colors and line styles change to reflect the gap's active or mitigated status.
Traders can use this tool to visualize market inefficiencies, receive early warnings of trend reversals, and identify precise entry and exit points. Risk management features include color-coded gap states, tracking of gap mitigation when price returns to the gap zone, and customizable color settings. The indicator supports practical strategies such as using gap detection for trend continuation signals and combining it with other indicators for decision-making. Stop-loss placement near gap boundaries and monitoring gap mitigation for trend reversal are also supported.
Müşteri değerlendirmeleri
5 | 100 % | |
4 | 0 % | |
3 | 0 % | |
2 | 0 % | |
1 | 0 % |