
Açıklama
⚡ Nebula Aralık Filtresi Pro cTrader için profesyonel bir trend filtre göstergesidir ve traderların piyasa gürültüsünü kesip sadece anlamlı hareketlere odaklanmasına yardımcı olur.
Hareketli ortalama taban çizgisi ile uyarlanabilir aralık filtresini birleştirerek, Nebula rastgele dalgalanmaları görmezden gelirken temiz yükseliş ve düşüş fazlarını vurgular.
Bu, onu Forex, endeksler, emtialar ve kripto ticareti için en etkili gürültü filtre göstergelerinden biri yapar.
Daha fazla kaynak ve detaylı SSS için AlgoXP
📊 Nasıl çalışır
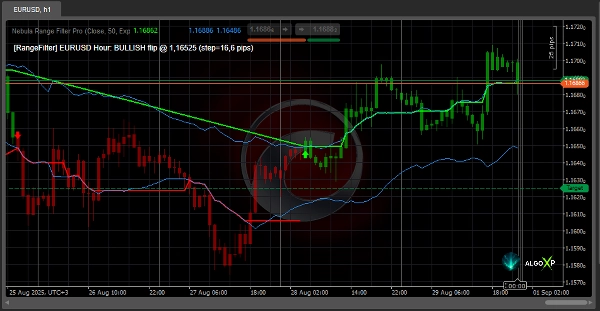
Gösterge bir taban hareketli ortalama oluşturur ve bunu dinamik bir kanal ile çevreler. Fiyat kanal içinde kaldığı sürece trend değişmez.
Fiyat kanal dışına çıktığında, gösterge yön değiştirir ve rengini değiştirir:
- Yeşil çizgi = Yükseliş fazı (uzun pozisyon eğilimi)
- Kırmızı çizgi = Düşüş fazı (kısa pozisyon eğilimi)
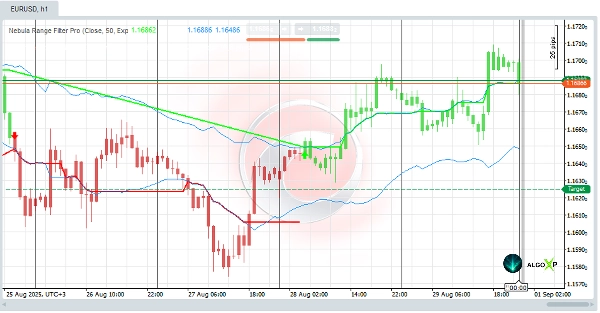
Ayrıca, mumları trende göre renklendirebilirsiniz — bu da grafiklerin görsel olarak daha temiz ve okunması kolay hale gelmesini sağlar.
Sonuç: güvenilir trend sinyalleri ile net bir grafik ve daha az yanlış uyarı.
✅ Ana Özellikler
- Hareketli ortalamaya dayalı gürültü aralığı ile trend filtreleme.
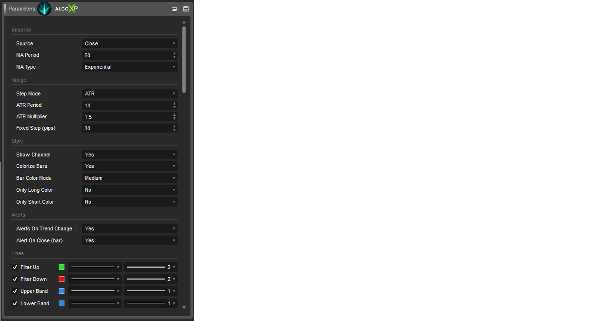
- Aralık boyutu için iki mod:
• ATR × çarpan (volatiliteye uyarlanabilir).
• Sabit pip (sabit boyut). - Görsel sinyaller:
• Yeşil çizgi = yükseliş fazı.
• Kırmızı çizgi = düşüş fazı. - İsteğe bağlı kanal gösterimi taban çizgisinin üstünde ve altında.
- Trend ile bar renklendirme üç stil ile: Parlak, Orta, Şeffaf.
- Sadece yükseliş veya sadece düşüş barlarını renklendirmek için ayrı seçenekler.
- Trend değişikliği uyarıları dönüşlerde (bar kapanışında onaylama seçeneği ile).
- Grafikte dönüş işaretçileri (dönüş noktalarında oklar).
🎯 Mükemmel İçin
- Gürültüsüz temiz bir grafik isteyen traderlar.
- Yanlış girişleri filtreleyen kısa zaman dilimlerinde (M5–M15) scalperlar.
- Trend takip eden breakout veya pullback sistemleri kullanan intraday traderlar.
- Sadece büyük trend değişimlerini görmek isteyen swing traderlar.
- Gösterge dönüşlerini cBotlarda giriş sinyali olarak kullanan algoritmik traderlar.
⚡ Neden Pro?
- Kontrol: uyarılar ve görsel işaretçiler, ekrana bakmadan dönüşleri yakalamaya yardımcı olur.
- Disiplin: her tik değil, sadece önemli dönüşleri gösterir.
- Esneklik: ATR modu piyasa volatilitesine uyum sağlar, Sabit mod stabil filtreyi korur.
Açıklık: renkli çizgiler, kanallar ve bar gölgelendirmesi trendin kolay okunmasını sağlar.
Özet
Key features include two modes for setting the range size—an ATR-based adaptive mode and a fixed pips mode—visual trend signals, optional channel display, customizable bar coloring styles, separate options for coloring bullish or bearish bars, trend change alerts with confirmation options, and flip markers at reversal points.
The indicator supports multiple markets including Forex, indices, commodities, cryptocurrencies, and stocks. It is suitable for scalpers, intraday traders, swing traders, and algorithmic traders who rely on trend signals for entries. Nebula Range Filter Pro aims to provide a clear chart with reliable trend signals and reduced false alerts through its noise filtering approach.
Müşteri değerlendirmeleri
5 | 100 % | |
4 | 0 % | |
3 | 0 % | |
2 | 0 % | |
1 | 0 % |


