
Açıklama
ZigzagSR – Otomatik Destek ve Direnç ile Dinamik Zigzag Salınımları
ZigzagSR ile daha net piyasa yapısı ve hassas giriş bölgelerinin kilidini açın, güçlü bir cTrader göstergesi:
- Gerçek zamanlı olarak yeniden çizilmeyen zigzag salınımlarını (yüksek yüksekler, düşük yüksekler, yüksek düşükler, düşük düşükler) çizer
- En son pivot salınımlarına dayalı dinamik destek ve direnç seviyelerini otomatik olarak çizer
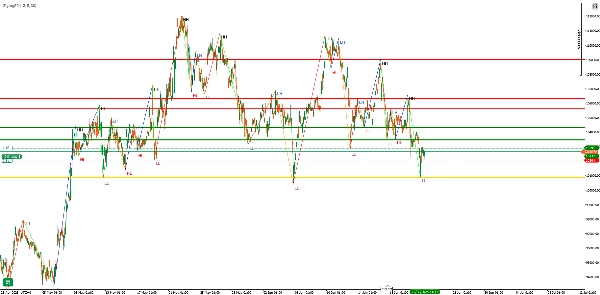
- Her salınım noktasını (“HH”, “LH”, “HL”, “LL”) anında trend netliği için etiketler
Ana Özellikler
- Uyarlanabilir Zigzag Algılama
-
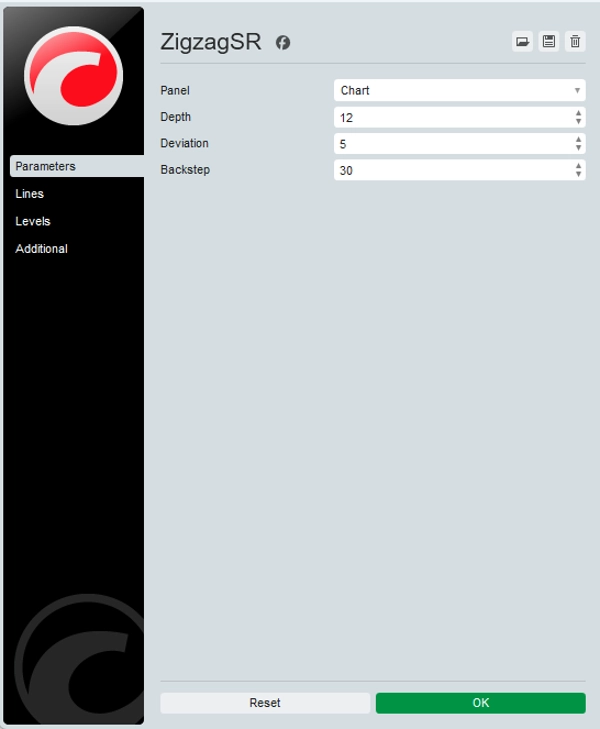
- Piyasa gürültüsüne duyarlılığı ince ayar yapmak için yapılandırılabilir Derinlik, Sapma ve Geri Adım parametreleri
- Yeniden çizilmeyen mantık, çizildikten sonra geçmiş sinyallerin sabit kalmasını sağlar
- Otomatik SR Seviyeleri
-
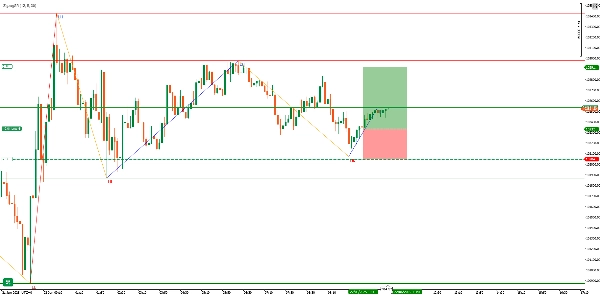
- Son geçerli salınım noktasında bir Pivot çizgisi çizer (altın çizgi)
- Pivot öncesinde son üç Direnç yükseklerini (kırmızı çizgiler) ve üç Destek düşüklerini (yeşil çizgiler) vurgular
- Yeni salınımlar oluşurken çizgiler sorunsuzca güncellenir, grafiğiniz düzenli kalır
- Net Görsel Etiketler
-
- Ayı/higher zirveler için “HH” (Yüksek Yüksek) ve “LH” (Düşük Yüksek)
- Boğa/düşük çukurlar için “HL” (Yüksek Düşük) ve “LL” (Düşük Düşük)
- Renk kodlu zigzag segmentleri:
-
- HH → Lime
- LH → Turuncu
- HL → Mavi
- LL → Kırmızı
Girdiler ve Özelleştirme
ParametreVarsayılanAçıklama
Derinlik
12
Yerel yüksek/düşükleri belirlemek için geriye dönük bar sayısı
Sapma
5
Salınım olarak sayılacak minimum fiyat hareketi (tick cinsinden)
Geri Adım
3
Yanlış pivotları bastırmak için “geri sarılacak” bar sayısı
İpucu: Daha yüksek zaman dilimlerinde gürültüyü filtrelemek için Derinlik ve Sapma değerlerini artırın; M1/M5 için duyarlılığı artırmak üzere azaltın.
Neden ZigzagSR Kullanmalı?
- Trend Onayı: İmpulsif salınımlar ile düzeltici hareketleri net şekilde ayırt edin—salınım ve kırılma işlemcileri için ideal.
- SR Giriş Bölgeleri: Otomatik işaretlenen seviyeler, giriş, stop-loss ve kar al bölgelerini manuel çizgi çekmeden belirlemenize yardımcı olur.
- Strateji Geliştirme: Etiketler ve çizgiler doğrudan EA’lara/cBot’lara veya manuel sistemlere beslenir—tutarlı, kural tabanlı kurulumlar oluşturun.
Nasıl Çalışır
- Yüksek/Düşük Haritalama
-
- Yerel ekstremleri işaretlemek için son
Derinlikperiyotlarındaki barları tarar (_highMap&_lowMap).
- Yerel ekstremleri işaretlemek için son
- Salınım Oluşumu
-
- Boğa ve ayı durumları arasında geçiş yapar, sadece önemli pivotları salınım listesine ekler.
- Etiket Atama
-
- Her pivotu önceki ile karşılaştırarak HH/LH veya HL/LL olarak etiketler.
- SR Çizimi
-
- En son pivotu “pivot çizgisi” olarak tanımlar, ardından önceki üç geçerli yüksek ve düşükleri direnç/destek olarak çizer.
- Zigzag Görselleştirme
-
- Tüm salınım noktalarını renkli trend çizgileriyle bağlar ve netlik için hafifçe kaydırılmış metin etiketleri ekler.
Kullanım Alanları ve İpuçları
- Salınım Ticareti: Çoklu bar impulslarında hareket edin—pivot çizgisine geri çekilmelerde giriş yapın, sonraki SR seviyesini hedefleyin.
- Kırılma Onayı: ZigzagSR tarafından çizilen direnç çizgisinin fiyat tarafından kırılmasını bekleyin, ardından hacim veya RSI ile onaylayın.
- Diğer Göstergelerle Birleştirme: Sinyalleri güçlendirmek için hareketli ortalamalar, RSI uyumsuzlukları veya hacim profilleri ile birleştirin.
Saniyeler içinde başlayın:
- ZigzagSR’yi cTrader Mağazası’ndan yükleyin.
- Herhangi bir grafiğe bırakın—dış kütüphane gerekmez.
- Üç giriş parametresini tercih ettiğiniz zaman dilimi ve strateji stiline göre ayarlayın.
Gerçek zamanlı salınım yapısı ve dinamik destek & direnç ile grafik analizlerinizi yükseltin—bugün ZigzagSR’yi deneyin!
Özet
Müşteri değerlendirmeleri
5 | 33 % | |
4 | 67 % | |
3 | 0 % | |
2 | 0 % | |
1 | 0 % |


