

Açıklama
🧠 Gelişmiş RSI Göstergesi – Hassas Momentum Analizi
Daha Akıllı Bir RSI ile Piyasa Trendlerine Daha Derin Bakış Kazanın
The Advanced RSI Indicator, hassasiyet ve akıllı sinyal filtrelemesini önemseyen traderlar için geliştirilmiş klasik RSI aracının güçlü bir evrimidir. Gelişmiş algoritmik yumuşatma, uyarlanabilir bölgeler ve entegre uyumsuzluk tespiti ile bu araç, tüm piyasa ve zaman dilimleri için rafine momentum analizi sağlar.
🔍 Temel Özellikler:
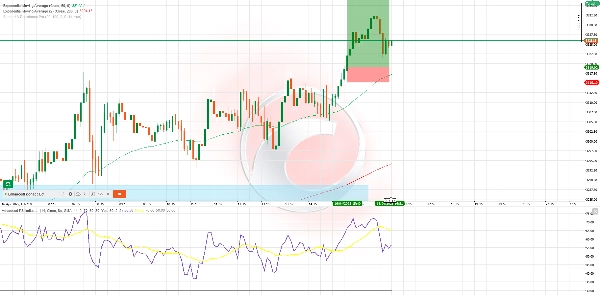
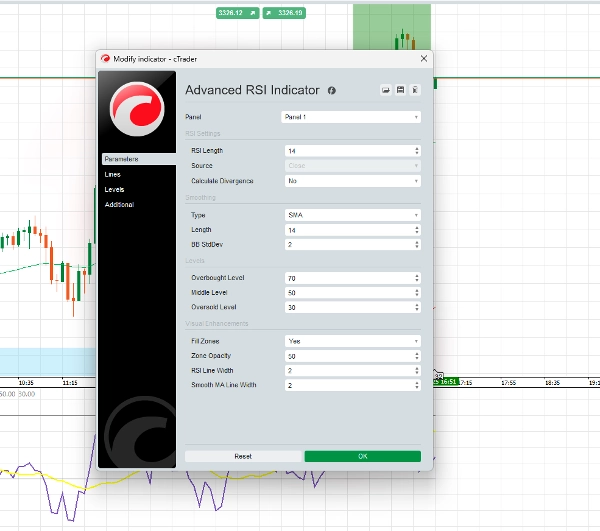
✅ Yumuşatılmış RSI Eğrisi
Piyasa trendlerine daha net bakış için dalgalı hareketleri ve yanlış sinyalleri azaltır.
✅ Uyarlanabilir Sinyal Bölgeleri
Piyasa volatilitesine tepki veren dinamik eşiklerle geleneksel 70/30 seviyelerinin ötesine geçer.
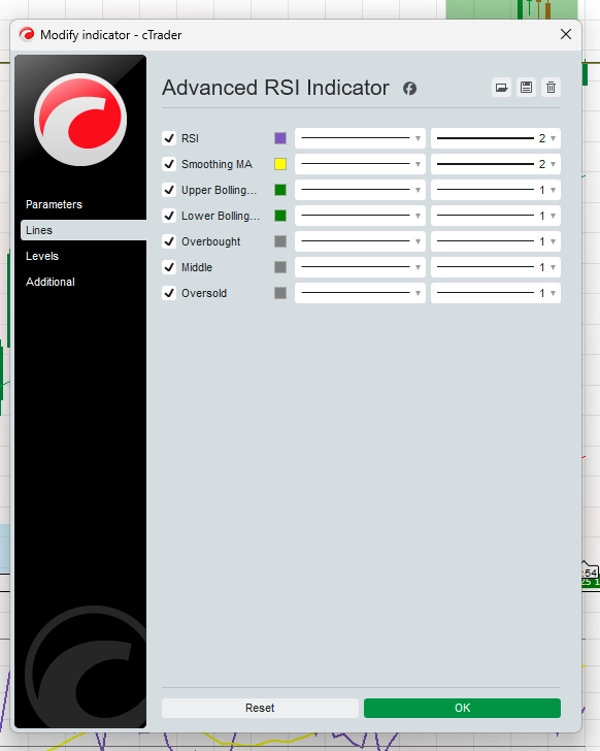
✅ Renk Kodlu Momentum Bölgeleri
Boğa veya ayı momentumu hızlıca sezgisel görsel tasarımla değerlendirin.
✅ Uyumsuzluk Uyarıları
Stratejik karar vermeyi desteklemek için boğa ve ayı uyumsuzluk kurulumlarını vurgular.
✅ Özel Uyarı Sistemi
RSI seviye geçişleri ve uyumsuzluk sinyalleri için uyarılar kurun, böylece önemli anları asla kaçırmayın.
✅ Çoklu Varlık, Çoklu Zaman Dilimi
Forex, kripto, hisse senetleri, endeksler ve daha fazlası için optimize edilmiştir — M1’den günlük grafiklere kadar.
⚙️ Strateji Örneği – RSI Dalga Sürüşü
En uygun: H1 & H4 salınım işlemleri
Kullanılan göstergeler: Gelişmiş RSI, 50 EMA, 200 EMA
Alış Örneği:
- Fiyat 50 & 200 EMA’nın üzerinde
- RSI 40’ın altına düşer ve yükselmeye başlar
- Boğa momentumu rengi belirir
- (İsteğe bağlı) Boğa uyumsuzluğu tespit edildi
- Giriş: Sinyalin üzerinde mum kapanışı
- SL: Son salınım dip seviyesinin altında
- TP: Riskin 1.5x–2x’si veya yakın direnç
Satış Örneği:
- Fiyat 50 & 200 EMA’nın altında
- RSI 60’ın üzerine çıkar, sonra düşmeye başlar
- Ayı momentumu rengi yönü doğrular
- (İsteğe bağlı) Ayı uyumsuzluğu gücü artırır
- Giriş: Onay mum kapanışı
- SL: Son salınım zirvesinin üzerinde
- TP: Riskin 1.5x–2x’si veya yakın destek
💬 Neden Traderlar Bu Aracı Tercih Ediyor:
- Kullanıcı dostu, ancak güçlü
- Yeniden boyanmayan sinyaller
- Büyük piyasalarda test edilmiş
- Tek başına veya diğer stratejilerle birlikte kullanılabilir
Özet
Müşteri değerlendirmeleri
5 | 100 % | |
4 | 0 % | |
3 | 0 % | |
2 | 0 % | |
1 | 0 % |


!["[Hamster-Coder] Pivot Points MTF" logosu](https://cdn.ctrader.com/image/webp/4c143e5a-309c-40e3-a578-f04d1e133ffa_31159)


