
Описание
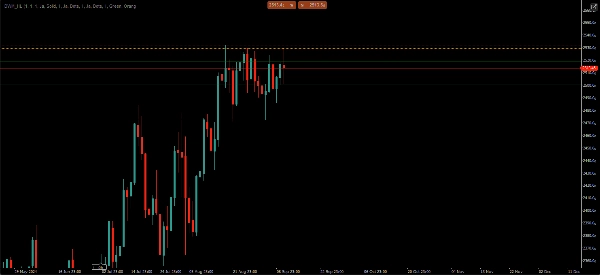
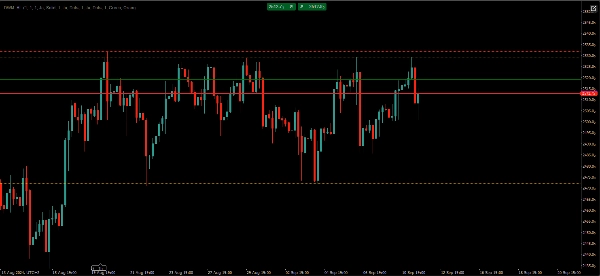
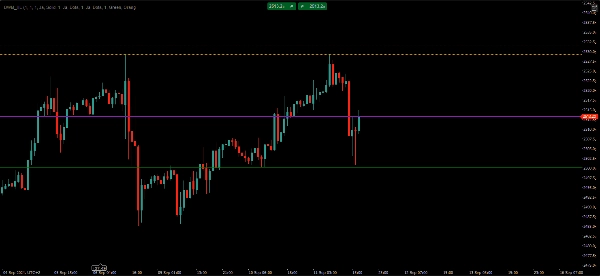
Уровни ликвидности NGS – дневные • недельные • месячные максимумы и минимумы
Торгуйте вокруг ликвидности, а не вокруг случайных линий.
NGS Liquidity Levels автоматически отображает самые важные дневные, недельные и месячные уровни ликвидности на каждом графике.
• Без ручного рисования
• Без переключения таймфреймов
• Без загромождения графика
Этот удобный индикатор помогает трейдерам за считанные секунды определить ключевые уровни ликвидности и структуры рынка. Вместо того чтобы вручную отмечать максимумы и минимумы каждый день, самые важные уровни автоматически отображаются и обновляются для вас.
Особенности:
• Автоматические дневные максимумы и минимумы
• Автоматические недельные максимумы и минимумы
• Автоматические месячные максимумы и минимумы
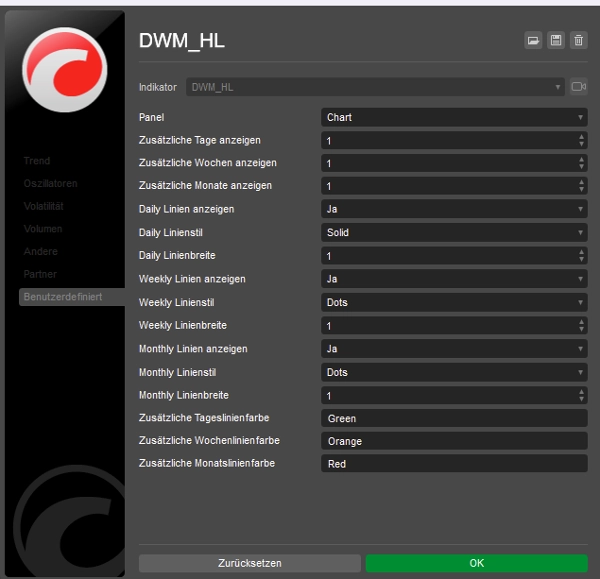
• Опциональные уровни предыдущих периодов
• Настраиваемые цвета и стили линий
• Чистое и легкое отображение на графике
• Работает с Forex, индексами, товарами и криптовалютами
• Поддержка нескольких таймфреймов
• Без перерисовки
Разработан для трейдеров, которые сосредоточены на структуре рынка, ликвидности и уровнях старших таймфреймов.
Без сигналов.
Без стратегий.
Без обещаний прибыли.
Только объективные уровни ликвидности и более чистый торговый процесс.
Сводка
Отзывы покупателей
5 | 100 % | |
4 | 0 % | |
3 | 0 % | |
2 | 0 % | |
1 | 0 % |


![Логотип продукта "Gaussian Channel [Iridio Capital]"](https://cdn.ctrader.com/image/webp/7c039209-5573-4a54-a072-f9528b503103_41960)


![Логотип продукта "Smart Money Concepts (SMC) [Iridio Capital]"](https://cdn.ctrader.com/image/webp/28b69fd1-ef54-4bed-9487-07e78e883be4_40934)

