
Описание
Индекс Торгуемости на Нескольких Таймфреймах
The Индекс Торгуемости на Нескольких Таймфреймах — это продвинутый анализатор рыночных условий, который определяет, когда рынок статистически благоприятен для торговли. Вместо генерации сигналов на покупку или продажу он измеряет, насколько торгуемы текущие рыночные условия на разных таймфреймах, позволяя сосредоточиться только на периодах, когда ценовое движение чистое, направленное и способно создавать значимые движения.
В отличие от традиционных индикаторов, которые опираются на фиксированные пороги, этот индикатор постоянно адаптируется к каждому таймфрейму, сравнивая текущее поведение рынка с собственной исторической базой. Такой самокалибрующийся подход позволяет ему работать на Forex, индексах, товарах, криптовалютах и других рынках CFD без необходимости ручной оптимизации.
Как это работает
Индикатор оценивает шесть независимых характеристик рынка на каждом таймфрейме.
Тренд против случайности с использованием Индекса Рыночной Средности (Market Meanness Index).
Гладкость против резкости с использованием Фрактальной Размерности (Fractal Dimension).
Отношение сигнала к шуму для определения, доминируют ли значимые колебания над случайными флуктуациями.
Чистота тренда, измеряемая по эффективности движения цены вместо постоянных разворотов.
Частота торговых возможностей, подсчитываемая по значимым колебаниям.
Чистый направленный прогресс для определения, делает ли цена значимый прогресс, а не повторно откатывается.
Каждый фактор нормализуется относительно собственного исторического поведения с использованием статистического анализа z-оценок. Это означает, что индикатор оценивает, являются ли текущие условия необычно благоприятными, а не просто выше или ниже произвольного порога.
Нормализованные факторы объединяются в взвешенный балл в диапазоне от 0 до 100.
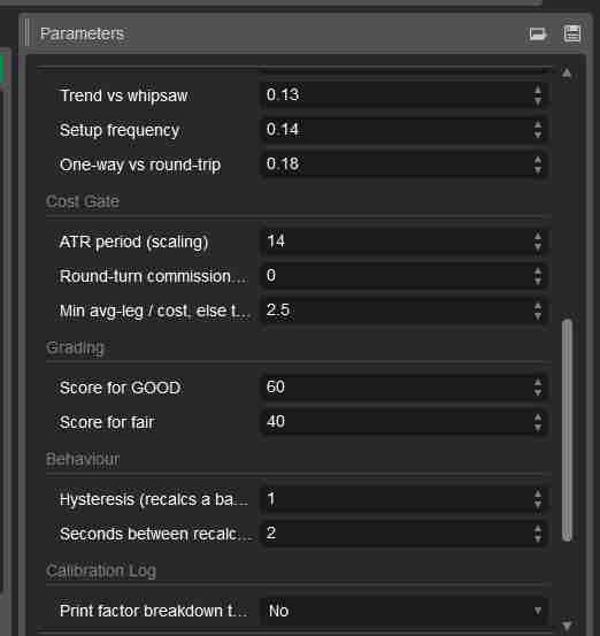
Индикатор также включает фильтр затрат на транзакции, который предотвращает получение высоких оценок короткими таймфреймами, когда средние ценовые колебания слишком малы, чтобы реально покрыть спреды и комиссии.
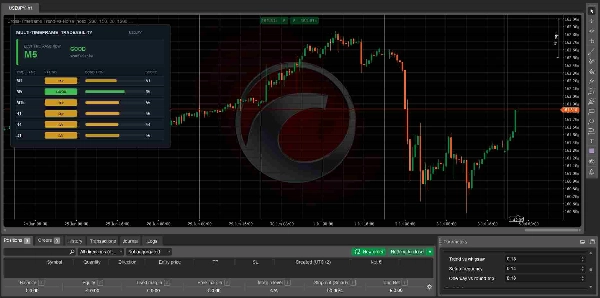
Панель управления
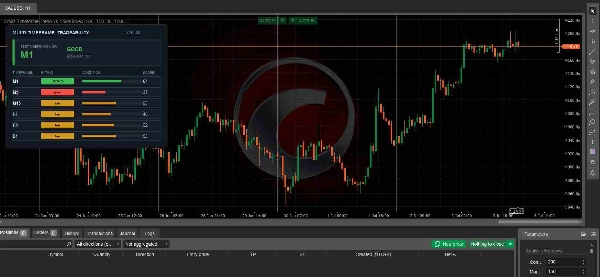
Панель управления анализирует шесть таймфреймов одновременно.
M1
M5
M15
H1
H4
D1
Каждому таймфрейму присваивается один из трёх рейтингов.
GOOD означает очень благоприятные рыночные условия.
FAIR означает приемлемые, но менее идеальные условия.
POOR означает, что структура рынка в настоящее время неблагоприятна.
Индикатор автоматически выделяет таймфрейм с наивысшим баллом вместе с его текущим рейтингом Торгуемости.
Интерпретация оценок
80 до 100 означает исключительные торговые условия с сильным направленным движением и низким уровнем рыночного шума.
60 до 79 означает очень хорошие условия, при которых торговые стратегии, вероятно, будут работать хорошо.
40 до 59 означает средние условия, где рекомендуется избирательность.
Ниже 40 означает плохую структуру рынка с чрезмерной случайностью, резкостью или недостаточным движением.
Высокие оценки не предсказывают направление рынка. Они просто указывают, что любое направление, которое разовьется, статистически более вероятно приведет к более чистому и торгуемому ценовому движению.
Основные параметры
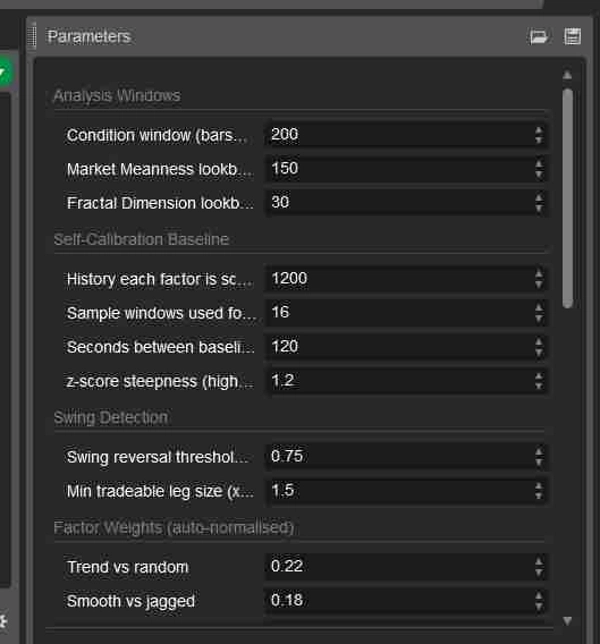
Окна анализа контролируют, сколько рыночной истории используется для расчёта каждого фактора.
Базовая линия самокалибровки определяет, как выполняется историческая нормализация.
Обнаружение колебаний регулирует чувствительность, используемую для идентификации значимых ценовых колебаний.
Веса факторов позволяют продвинутым пользователям усилить или уменьшить важность каждой рыночной характеристики.
Фильтр затрат контролирует, насколько агрессивно затраты на транзакции влияют на итоговый рейтинг.
Настройки оценки определяют пороги баллов для классификаций GOOD и FAIR.
Настройки панели управления позволяют полностью контролировать размер панели и положение на экране.
Лучшие случаи использования
Поиск наиболее торгуемого таймфрейма перед поиском входов.
Избегание боковых, шумных или низкокачественных рыночных условий.
Фильтрация сигналов из существующих торговых стратегий.
Улучшение дискреционной торговли, сосредотачиваясь только на статистически благоприятных условиях.
Поддержка алгоритмических систем с адаптивным фильтром рыночных условий.
Для кого это
Этот индикатор подходит для новичков, которые хотят объективных рекомендаций о том, когда рыночные условия благоприятны, а также для опытных дискреционных и алгоритмических трейдеров, ищущих адаптивный фильтр качества рынка, работающий на нескольких инструментах и таймфреймах.
Важные замечания
Этот индикатор не является генератором сигналов на покупку или продажу.
Он не предсказывает направление цены в будущем.
Он измеряет только качество текущих рыночных условий.
Для достижения наилучших результатов комбинируйте его с вашей существующей стратегией входа, выхода и управления рисками. Сделки с наивысшей вероятностью обычно происходят, когда ваша собственная торговая установка совпадает с таймфреймами, получающими рейтинг Торгуемости GOOD.
Сводка
The indicator provides a weighted Tradeability Score from 0 to 100 for six timeframes (M1, M5, M15, H1, H4, D1), classifying each as GOOD, FAIR, or POOR based on current market quality. It includes a transaction cost filter to account for realistic trading conditions on shorter timeframes. The dashboard highlights the highest scoring timeframe and its score, helping traders focus on periods with clean, directional price action suitable for trading.
This tool does not generate buy or sell signals nor predict price direction; instead, it serves as a market quality filter to improve discretionary or algorithmic trading by signaling when conditions are statistically favorable. Key parameters allow customization of analysis windows, swing detection sensitivity, factor weights, and grading thresholds. It is suitable for traders seeking objective guidance on market structure and tradeability across multiple instruments and timeframes.