


Description
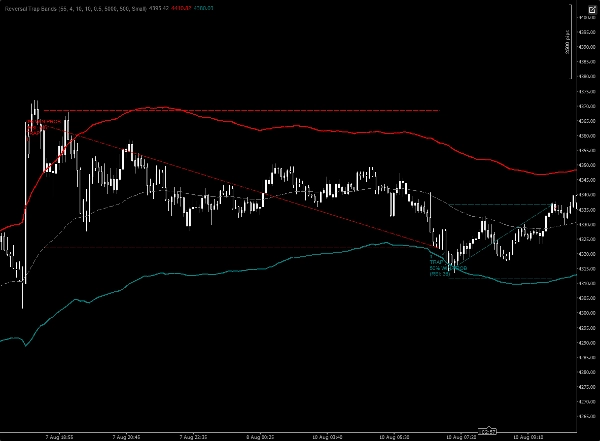
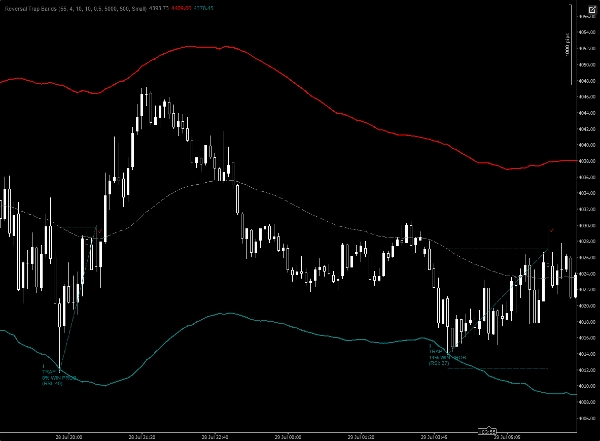
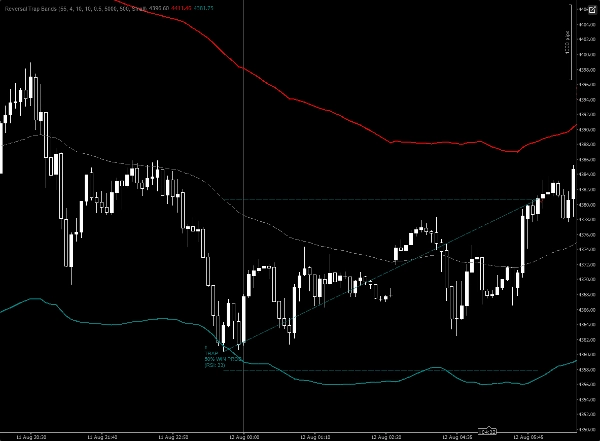
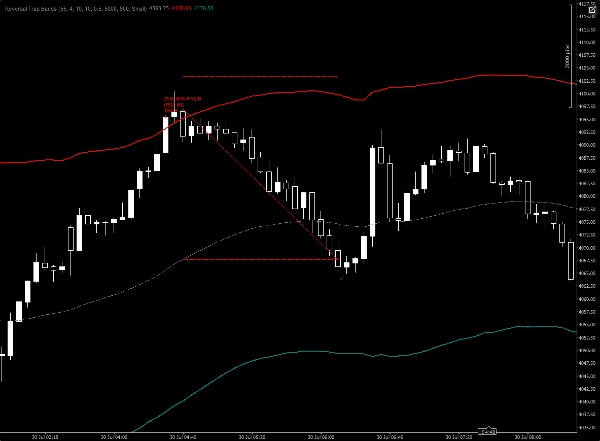
Reversal Trap Probability Bands is a self-learning reversal detection tool built around a volatility-adaptive price envelope. Instead of just flagging every touch of the outer bands, it specifically looks for "fakeout" traps — situations where price pushes beyond the envelope, fails to hold, and reverses back inside — which are often higher-probability turning points than a simple band touch.
What makes this indicator different is its built-in statistics engine. Every time a trap signal fires, the indicator classifies it by market condition and silently tracks whether that type of setup went on to reach its target or got stopped out. Over time, it builds a live probability score for each condition and displays that win rate directly on the chart the next time a similar setup appears — so you're not just seeing a signal, you're seeing how similar signals have historically performed on that exact instrument and timeframe.
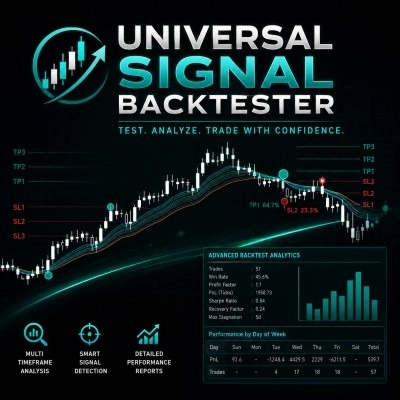
For every trap it detects, the indicator plots:
- A directional signal marking the reversal
- A projected target level
- A protective stop level
- A live win-probability readout for that type of setup
As price plays out, the indicator automatically tracks whether the target or stop was hit first, updates its internal database, and refines future probability readings — turning the chart into an evolving record of how reliable these reversal traps have actually been.
It's designed for traders who want reversal signals backed by evidence rather than a static formula — ideal for fading exhaustion moves, catching stop-hunts, and timing entries around volatility extremes across any market and timeframe.
Summary
Key features include a self-learning statistics engine that classifies each trap by market condition and tracks its outcome (target hit or stop triggered). This ongoing analysis generates a live probability score for similar setups, displayed directly on the chart to inform decision-making based on historical performance for the current instrument and timeframe.
For each detected trap, the indicator plots:
- A directional reversal signal
- A projected target level
- A protective stop level
- A live win-probability readout for that setup type
The indicator continuously updates its internal database as price action unfolds, refining future probability estimates. It supports visualization and reversal, trend strength, and level break signals, operating on bar data across any market and timeframe. This tool is suited for traders seeking evidence-based reversal signals to time entries around volatility extremes and potential stop-hunt scenarios.
Customer reviews
5 | 100 % | |
4 | 0 % | |
3 | 0 % | |
2 | 0 % | |
1 | 0 % |
Discussion
FAQ
More from this author
























Price