
Описание
Еженедельные и ежедневные разрывы открытия — индикатор NWOG и NDOG
Профессиональная визуализация разрывов открытия для институциональных трейдеров и серьёзных розничных участников
ОБЗОР
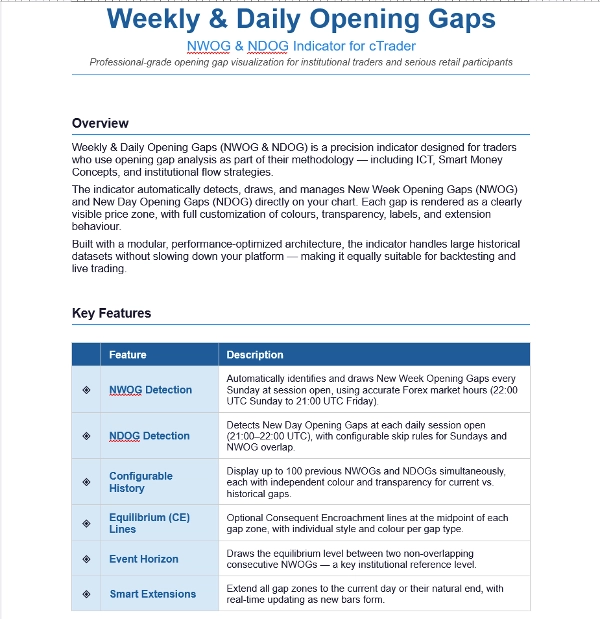
Еженедельные и ежедневные разрывы открытия (NWOG и NDOG) — это точный индикатор, предназначенный для трейдеров, использующих анализ разрывов открытия в своей методологии — включая ICT, концепции Smart Money и стратегии институционального потока.
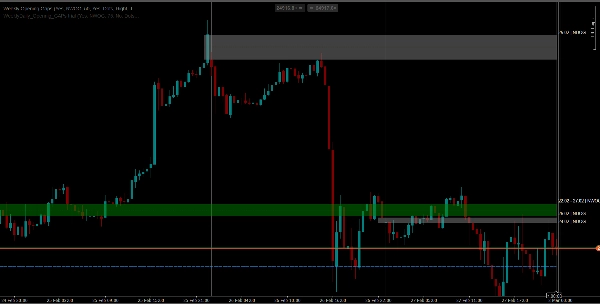
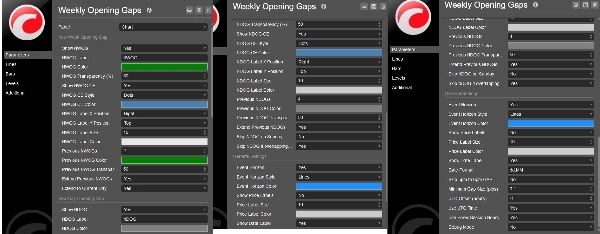
Индикатор автоматически обнаруживает, рисует и управляет новыми недельными разрывами открытия (NWOG) и новыми дневными разрывами открытия (NDOG) непосредственно на вашем графике. Каждый разрыв отображается как чёткая ценовая зона с полной настройкой цветов, прозрачности, меток и поведения расширения.
Созданный с модульной, оптимизированной по производительности архитектурой, индикатор обрабатывает большие исторические данные без замедления вашей платформы — что делает его одинаково подходящим для бэктестинга и торговли в реальном времени.
КЛЮЧЕВЫЕ ОСОБЕННОСТИ
◈ Обнаружение NWOG
◈ Обнаружение NDOG с настраиваемыми правилами пропуска для воскресений и перекрытия NWOG.
◈ Настраиваемая история — отображение до 100 предыдущих NWOG
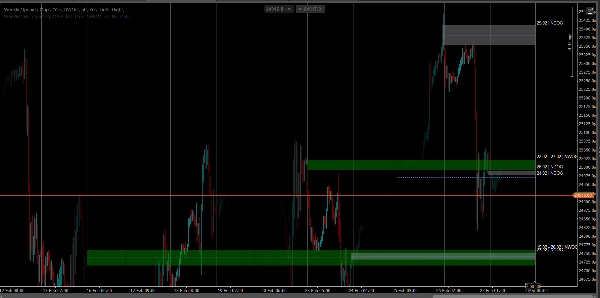
◈ Линии равновесия (CE)
◈ Горизонт событий — рисует уровень равновесия между двумя неперекрывающимися последовательными NWOG
◈ Умные расширения — расширяют все зоны разрывов до текущего дня или их естественного окончания с обновлением в реальном времени по мере формирования новых баров.
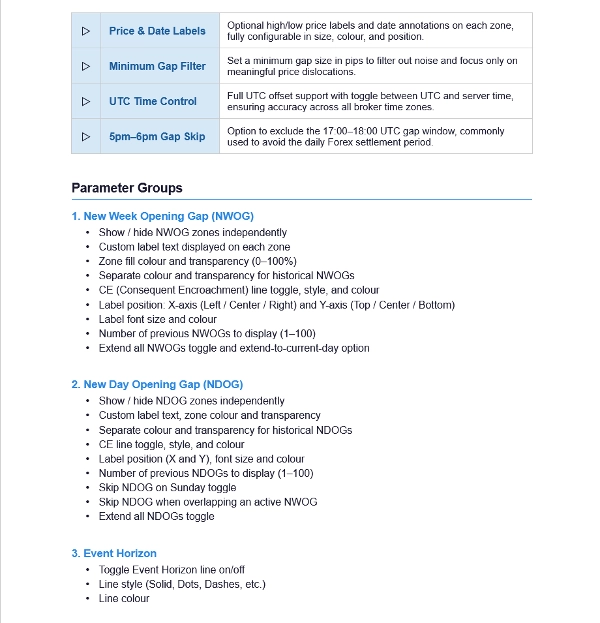
◈ Метки цены и даты
◈ Фильтр минимального разрыва
◈ Управление временем UTC
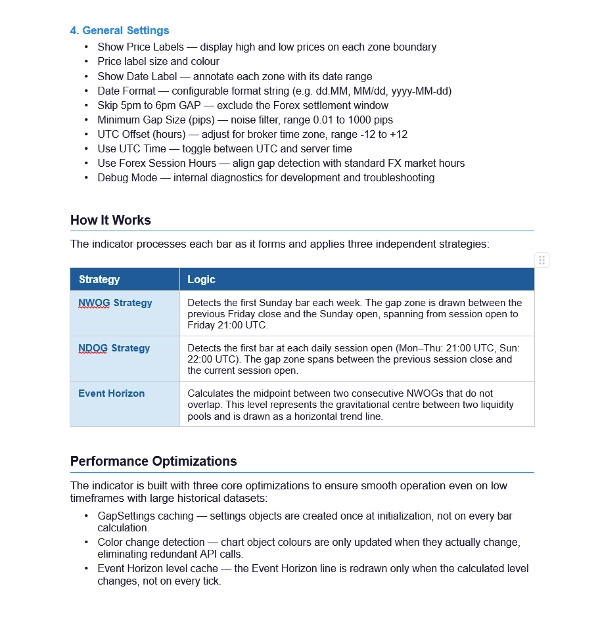
КАК ЭТО РАБОТАЕТ
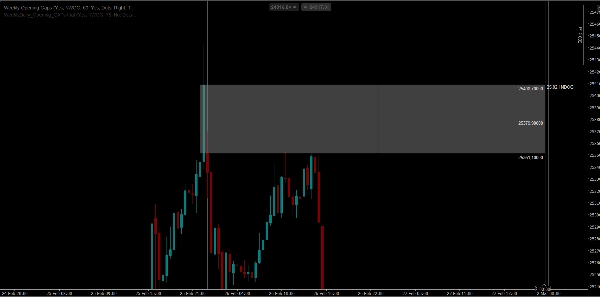
Стратегия NWOG — обнаруживает первый бар воскресенья каждой недели. Зона разрыва рисуется между закрытием предыдущей пятницы и открытием воскресенья, охватывая сессию открытия до пятницы 21:00 UTC.
Стратегия NDOG — обнаруживает первый бар на каждом дневном открытии сессии (пн–чт: 21:00 UTC, вс: 22:00 UTC). Зона разрыва охватывает промежуток между закрытием предыдущей сессии и открытием текущей.
Горизонт событий — вычисляет среднюю точку между двумя последовательными NWOG, которые не перекрываются. Этот уровень представляет собой гравитационный центр между двумя пулами ликвидности и отображается в виде горизонтальной трендовой линии.
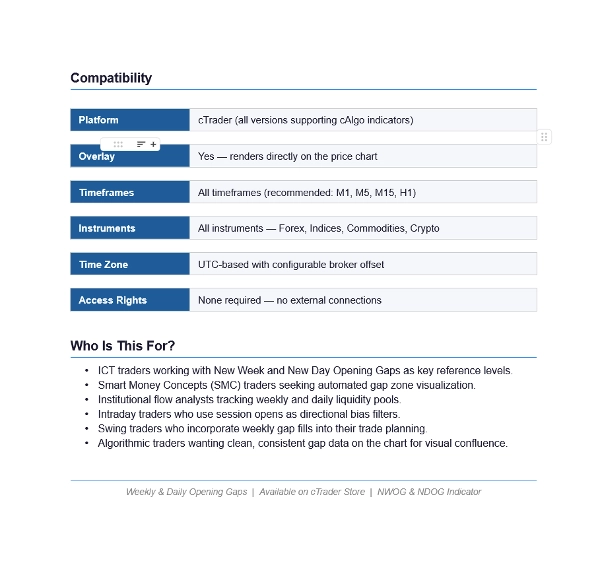
СОВМЕСТИМОСТЬ
Платформа: cTrader (все версии, поддерживающие индикаторы cAlgo)
Наложение: Да — отображается непосредственно на ценовом графике
Таймфреймы: Все таймфреймы (рекомендуется: M1, M5, M15, H1)
Инструменты: Все — Форекс, индексы, товары, C
ДЛЯ КОГО ЭТО?
Трейдеры ICT, работающие с новыми недельными и дневными разрывами открытия как ключевыми уровнями
Трейдеры Smart Money Concepts (SMC), ищущие автоматизированную визуализацию зон разрывов
Аналитики институционального потока, отслеживающие еженедельные и ежедневные пулы ликвидности
Интрадей трейдеры, использующие открытия сессий как фильтры направленного смещения
Свинг-трейдеры, включающие еженедельные заполнения разрывов в своё торговое планирование
Алгоритмические трейдеры, желающие иметь чистые, последовательные данные о разрывах на графике для визуального подтверждения
Сводка
Отзывы покупателей
5 | 0 % | |
4 | 100 % | |
3 | 0 % | |
2 | 0 % | |
1 | 0 % |


![Логотип продукта "[Hamster-Coder] Moving Average MTF"](https://cdn.ctrader.com/image/webp/b11b98b1-194d-4b8e-b00e-d611826ad159_31226)


