
Описание
| ALL IN ONE TRADING PRO|
## Что это за индикатор?
Этот индикатор размещает на вашем графике **три полезных торговых инструмента** одновременно. Представьте, что у вас есть три опытных трейдера, которые одновременно дают вам свои рекомендации
=====================================================
## Три инструмента
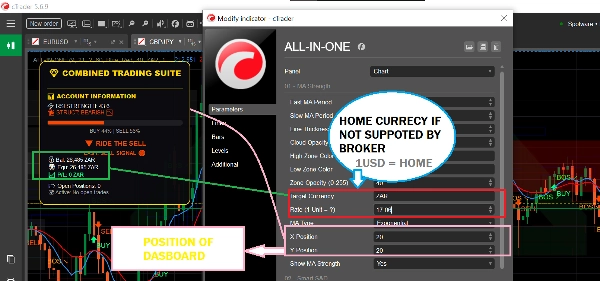
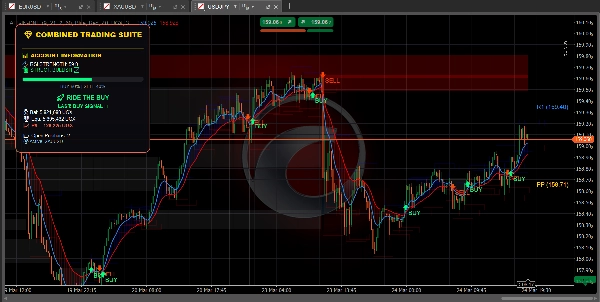
### 1. ПАНЕЛЬ ТРЕНДОВ (Отслеживатель тренда)
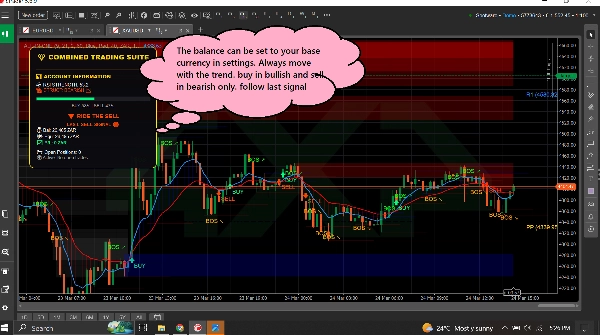
**Что делает:** Показывает направление движения рынка и силу этого движения.
**Что вы видите:**
- **Синяя линия** = Быстрая скользящая средняя (краткосрочный тренд)
- **Красная линия** = Медленная скользящая средняя (долгосрочный тренд)
- **Синее облако** = Восходящий тренд (цена растет)
- **Красное облако** = Нисходящий тренд (цена падает)
- **Зеленая стрелка** = Появляется сигнал на ПОКУПКУ
- **Красная стрелка** = Появляется сигнал на ПРОДАЖУ
- **Полоса RSI** = Показывает, перекуплен ли рынок (слишком высоко) или перепродан (слишком низко)
========================================================
**Также показывает:**
- Баланс вашего счета и прибыль/убыток
- Сколько позиций у вас открыто
- Простые текстовые советы, такие как "БЕЗОПАСНО ПОКУПАТЬ" или "ПОЕХАЛИ ПОКУПАТЬ"
============================================================
### 2. ЗОНЫ СПРОСА И ПРЕДЛОЖЕНИЯ (Поиск ключевых уровней)
**Что делает:** Находит важные ценовые уровни, где рынок может развернуться или задержаться.
**Что вы видите:**
- **Синие прямоугольники** = Зоны спроса (области, где покупатели вступают в игру - ХОРОШО для покупки)
- **Красные прямоугольники** = Зоны предложения (области, где продавцы вступают в игру - ХОРОШО для продажи)
- **Серые прямоугольники** = Зоны, которые были протестированы (менее надежные)
============================================================
**Как использовать:**
- Цена идет ВНИЗ к синему прямоугольнику? Рассматривайте покупку
- Цена идет ВВЕРХ к красному прямоугольнику? Рассматривайте продажу
- Свежие (яркие) прямоугольники работают лучше, чем серые
============================================================
**Также показывает:**
- **BOS ↗** = Рынок пробил вверх, тренд может продолжиться вверх
- **BOS ↘** = Рынок пробил вниз, тренд может продолжиться вниз
============================================================
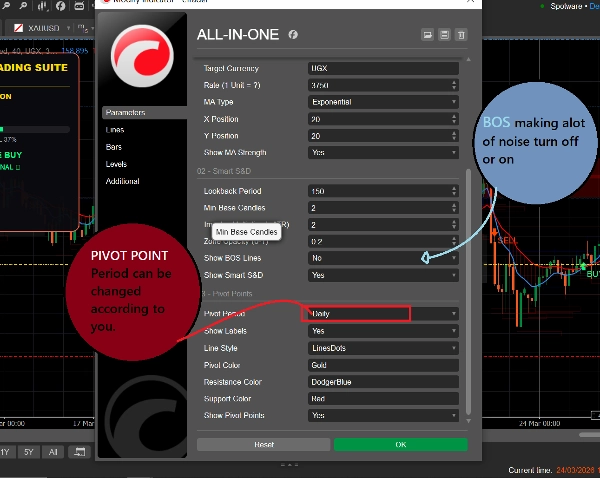
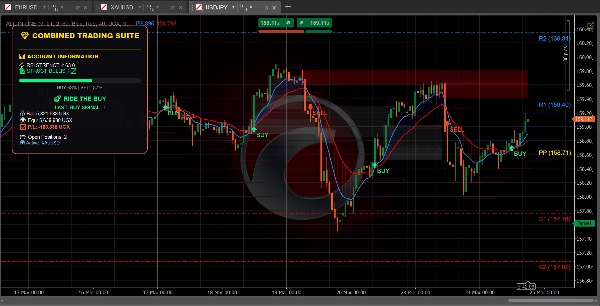
### 3. ПИВОТНЫЕ ТОЧКИ (Уровни поддержки и сопротивления)
**Что делает:** Автоматически рассчитывает ценовые уровни, на которых рынок часто останавливается или разворачивается.
**Что вы видите:**
- **Золотая линия** = Пивот (центральный уровень)
- **Синие линии** = Уровни сопротивления (цена может здесь упасть)
- **Красные линии** = Уровни поддержки (цена может здесь вырасти)
============================================================
**Вы можете выбрать:**
- **Ежедневные** = Уровни меняются раз в день
- **Еженедельные** = Уровни меняются раз в неделю
- **Ежемесячные** = Уровни меняются раз в месяц
- **15-минутные** = Уровни меняются каждые 15 минут (хорошо для быстрой торговли)
============================================================
## Как использовать (просто)
### Чтобы найти сделку на ПОКУПКУ:
1. Дождитесь, пока цена достигнет **синей зоны спроса**
2. Проверьте, находится ли синяя линия MA выше красной линии MA (восходящий тренд)
3. Сигналы следует учитывать только если рынок находится в правильном тренде
============================================================
### Чтобы найти сделку на ПРОДАЖУ:
1. Дождитесь, пока цена достигнет **красной зоны предложения**
2. Проверьте, находится ли красная линия MA выше синей линии MA (нисходящий тренд)
3. Сигналы следует учитывать только если рынок находится в правильном тренде
============================================================
### Чтобы находить быстрые сделки:
1. Используйте 15-минутные пивотные точки для точных уровней
2. Следите за стрелками BOS для направления тренда
3. Проверяйте панель для оценки силы рынка
4. Совершайте сделки, соответствующие направлению
============================================================
## Что означают все цвета
| Цвет | Что означает |
| 🟦 Синий | Бычий / сигналы на покупку / зоны спроса / пивоты сопротивления |
| 🔴 Красный | Медвежий / сигналы на продажу / зоны предложения / пивоты поддержки |
| 🟨 Золотой | Пивот (центральный уровень) |
| ⚪ Серый | Протестированные зоны (уже посещенные) |
| 🟢 Зеленая стрелка | Сигнал на ПОКУПКУ |
| 🔴 Красная стрелка | Сигнал на ПРОДАЖУ |
============================================================
## Простые настройки для начинающих
============================================================
### Для быстрой торговли (скальпинг):
- Период пивота: **15 минут**
- Быстрая MA: **5**
- Медленная MA: **13**
- Включить: Все три инструмента
============================================================
### Для дневной торговли:
- Период пивота: **Ежедневный**
- Быстрая MA: **9**
- Медленная MA: **21**
- Включить: Все три инструмента
============================================================
### Для долгосрочной торговли:
- Период пивота: **Еженедельный**
- Быстрая MA: **21**
- Медленная MA: **55**
- Включить: Панель трендов + Пивотные точки
=========================================================
## Одно правило, которое нужно запомнить
=========================================================
**Не торгуйте, когда инструменты расходятся во мнениях!**
Если панель показывает ПОКУПАТЬ, но цена находится в красной зоне предложения - дождитесь ясности.
Если панель показывает ПРОДАВАТЬ, но цена находится в синей зоне спроса - дождитесь ясности.
Лучшие сделки происходят, когда ВСЕ инструменты указывают в одном направлении.
============================================================
## Быстрый старт
1. Добавьте индикатор на ваш график
2. Сначала оставьте все настройки по умолчанию
3. Наблюдайте за поведением цены у цветных зон и линий
4. Через несколько дней настройте параметры под свой стиль
5. Используйте панель для мониторинга счета в реальном времени
============================================================
Вот и всё! Три инструмента, один индикатор, простая торговля.
Сводка
1. Trend Dashboard: Displays short-term (blue line) and long-term (red line) moving averages, colored clouds indicating uptrend (blue) or downtrend (red), buy (green arrow) and sell (red arrow) signals, and an RSI bar showing overbought or oversold conditions. It also shows account balance, open positions, and simple text advice.
2. Supply & Demand Zones: Highlights important price levels with blue boxes for demand zones (buying areas), red boxes for supply zones (selling areas), and gray boxes for tested zones (less reliable). It includes breakout signals (BOS arrows) indicating potential trend continuation.
3. Pivot Points: Automatically calculates support and resistance levels with a gold pivot point line, blue resistance lines, and red support lines. Users can select pivot periods from 15-minute to monthly intervals for different trading styles.
The indicator supports multiple markets including Forex, Crypto, Stocks, and Indices, and provides visual signals such as crossovers, breakouts, and level touches. It is designed for various trading styles, from scalping to long-term trading, with recommended settings for each. The tool emphasizes trading only when all three components align in direction to improve trade clarity and consistency.
Отзывы покупателей
5 | 100 % | |
4 | 0 % | |
3 | 0 % | |
2 | 0 % | |
1 | 0 % |


