
Описание
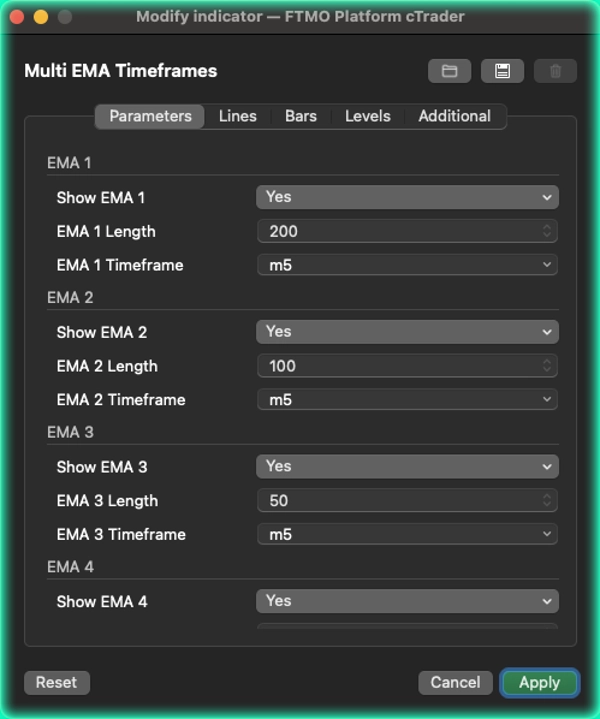
Multi EMA Timeframes от [BeyondTrading] Самая распространённая ошибка трейдеров при работе с скользящими средними — переключение таймфреймов только для того, чтобы проверить, где находится ключевая EMA. Multi EMA Timeframes полностью устраняет эту проблему. Вы остаетесь на своём рабочем таймфрейме — 5-минутном, 15-минутном, часовом — и точно задаёте, какая EMA с какого таймфрейма должна отображаться на вашем графике прямо сейчас, без переходов.
Вы на 5-минутном графике и хотите видеть 200 EMA с часового? Сделано. Также хотите видеть 50 EMA с 15-минутного и 20 EMA с текущего таймфрейма рядом? Тоже сделано. Каждая из пяти EMA настраивается полностью независимо: свой период, свой исходный таймфрейм, свой цвет и свой переключатель включения/выключения.
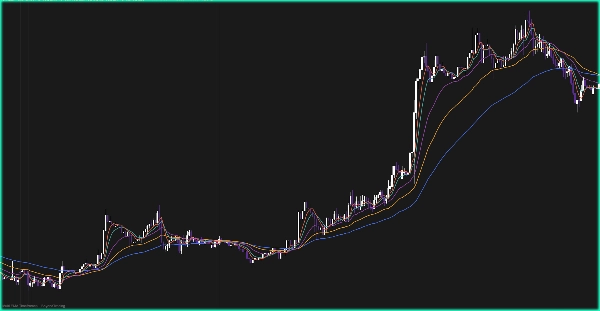
Это особенно полезно для настроек конвергенции. Когда цена на вашем таймфрейме входа приближается к EMA, принадлежащей гораздо более высокому таймфрейму, этот уровень имеет реальный структурный вес. Видеть его прямо на графике — без переключения вкладок, без сомнений в точном значении — меняет ваше взаимодействие с этими ключевыми зонами.
Два режима отображения позволяют контролировать, как рисуются линии. Режим Step фиксирует каждую EMA на последнем полностью закрытом баре исходного таймфрейма, так что значение не меняется до закрытия бара более высокого таймфрейма — нулевое перерисовывание, полностью надёжно для принятия торговых решений в реальном времени. Режим Smooth интерполирует значения непрерывно между барами исходного таймфрейма для более чистого визуала, лучше подходящего для анализа и обзора.
Что делает его особенным Большинство мульти-EMA индикаторов рассчитывают всё на текущем таймфрейме графика. Здесь же каждая EMA действительно берётся с собственного независимого таймфрейма. Вы не делаете приближений — вы читаете реальную EMA, которую видят трейдеры на том таймфрейме.
Особенности
- До 5 полностью независимых EMA, каждая со своим таймфреймом и периодом
- Оставайтесь на любом таймфрейме графика, считывая EMA с любого другого таймфрейма
- Режим Step: значения зафиксированы на закрытых барах исходного таймфрейма, без перерисовки
- Режим Smooth: линейная интерполяция для плавных визуальных переходов
- Переключатель показа/скрытия для каждой EMA, чтобы ваш график всегда оставался чистым
Сводка
Отзывы покупателей
5 | 50 % | |
4 | 50 % | |
3 | 0 % | |
2 | 0 % | |
1 | 0 % |


![Логотип продукта "[Stellar Strategies] Inside Bar with Signals"](https://cdn.ctrader.com/image/webp/1d9e8bfa-3b2c-4440-bb37-5856902008a7_30683)


