

Описание
Deep Mood Distribution (DMD) 📊🧠
Обзор
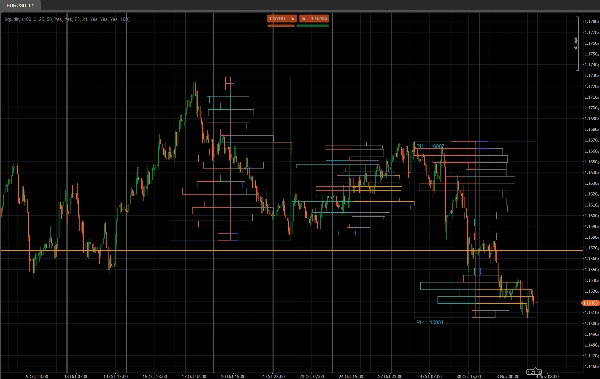
Deep Mood Distribution (DMD) — это инструмент сегментированного объемного профиля и сентимента, который анализирует ценовое движение в фиксированных блоках баров и показывает:
- Где концентрируется торговая активность ⚖️
- Где ликвидность тонкая или реактивная (потенциальные зоны спроса и предложения / ликвидности) 💧
- Какая сторона доминирует в каждой ценовой зоне (покупатели против продавцов) 🐂🐻
Вместо одного скользящего профиля DMD разбивает график на повторяющиеся блоки из X баров и строит отдельную карту ликвидности и сентимента для каждого блока.
Это облегчает визуальное сравнение того, как распределение объема и настроение рынка меняются от одного сегмента к другому.
Как это работает 🧩
Для каждого блока из Bars In Profile свечей:
- Индикатор находит самую высокую и самую низкую цену в этом блоке.
- Ценовой диапазон разбивается на
Number of Rowsвертикальных ценовых ячеек. - Для каждой свечи в блоке:
-
- Тиковый объем распределяется по каждой ценовой ячейке, затронутой диапазоном свечи.
- Для каждой строки накапливаются два объема:
-
- Общий объем на этой ценовой строке
- Бычий объем (только бары, где Close > Open)
- Из этого DMD строит:
-
- Профиль ликвидности (справа)
-
- Длина строки ∝ относительному объему по сравнению с максимальным объемом строки в блоке
- Цвет показывает высокие / средние / низкие торгуемые узлы
- Профиль сентимента (слева)
-
- Сентимент по строке =
2 × BullishVolume − TotalVolume - Положительный = доминирование покупателей (бычье настроение)
- Отрицательный = доминирование продавцов (медвежье настроение)
- Сентимент по строке =
- Процесс повторяется для последних N блоков, чтобы вы могли сравнивать несколько сегментов рядом.
Правая сторона – профиль ликвидности (объем) 📊
На правой стороне баров показано, сколько торговой активности (объема) произошло на каждом ценовом уровне в пределах этого блока, независимо от того, кто покупал или продавал.
- Узлы с высоким объемом (HVN) – например, оранжевые бары
-
- Строка, объем которой ≥
High Traded Threshold %от максимального объема строки в блоке - Представляют зоны стоимости, активную торговлю, зоны консолидации.
- Строка, объем которой ≥
- Узлы с низким объемом (LVN) – например, синие бары
-
- Строка, объем которой ≤
Low Traded Threshold %от максимального объема строки - Представляют зоны тонкой ликвидности, возможные уровни отторжения или зоны быстрого движения.
- Строка, объем которой ≤
- Узлы со средним объемом – например, серые бары
-
- Все, что между высокими и низкими порогами
- “Нормальные” уровни торговли, не экстремальные.
🧠 Длина бара (справа)
→ Пропорциональна общему объему торговли на этой ценовой строке по сравнению с максимальным объемом блока.
Больше объема → длиннее бар.
Ключевые параметры:
High Traded Threshold %Low Traded Threshold %
Левая сторона – профиль сентимента (настроение рынка) 🧠📉📈
На левой стороне баров показан сентимент / доминирование на каждом ценовом уровне: кто был сильнее в этой строке — покупатели или продавцы.
Для каждой строки:
Sentiment=2×BullishVolume−TotalVolume\text{Sentiment} = 2 \times \text{BullishVolume} - \text{TotalVolume}Sentiment=2×BullishVolume−TotalVolume
- Бычий бар (покупатели контролируют) – например, бирюзовые/зеленые бары
-
- Сентимент > 0
- Больше объема пришло от бычьих свечей (Close > Open) на этой цене.
- Указывает на доминирование покупателей на этой ценовой строке.
- Медвежий бар (продавцы контролируют) – например, красные бары
-
- Сентимент < 0
- Больше объема пришло от медвежьих свечей (Close < Open).
- Указывает на доминирование продавцов.
🧠 Длина бара (слева)
→ Пропорциональна абсолютному значению сентимента (|Sentiment|) относительно самой сильной строки в блоке.
Сильнее доминирование (большой дисбаланс между покупателями и продавцами) → длиннее бар.
Ключевой параметр:
Show Sentiment Profile(вкл/выкл)
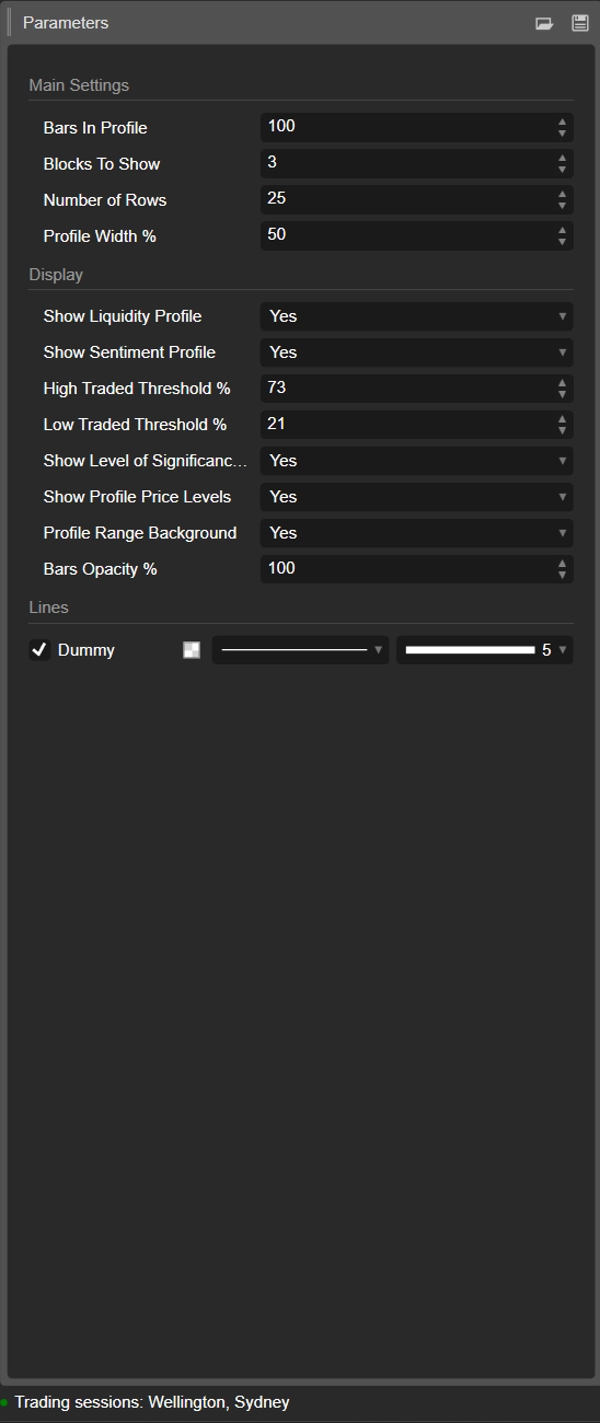
Детали параметров ⚙️
1. Bars In Profile
Группа: Основные настройки
Количество свечей, содержащихся в каждом блоке.
- Пример:
Bars In Profile = 100 -
- Блок 0 → последние 100 баров
- Блок 1 → предыдущие 100 баров
- Блок 2 → предыдущие 100, и так далее.
Используйте это, чтобы сопоставить блоки с:
- приблизительными сессиями,
- вашим типичным свингом / внутридневным диапазоном,
- или любым пользовательским окном, которое вы хотите проанализировать.
Меньшее значение = более реактивно, более детализировано.
Большее значение = более плавная, более «макро» структура.
2. Blocks To Show
Группа: Основные настройки
Сколько последовательных блоков будет отображено на графике.
1→ только самый последний блок2–3→ очень удобно для сравнения без загромождения- Более высокие значения → больше истории, но больше объектов на графике
Старые блоки за пределами этого значения автоматически очищаются для поддержания стабильности.
3. Number of Rows
Группа: Основные настройки
Вертикальное разрешение профиля каждого блока.
Ценовой диапазон блока делится на столько строк (ценовых уровней).
- Большее значение → больше деталей, тоньше строки, больше прямоугольников
- Меньшее значение → более плавная структура, легче читать
Типичные диапазоны:
15–25для обычного внутридневного использования30–40+только если вы хотите очень тонкое разрешение и ваша платформа достаточно мощная
4. Profile Width %
Группа: Основные настройки
Контролирует, насколько далеко профиль распространяется горизонтально от центра блока, в процентах от ширины блока.
- Влияет как на ликвидность (справа), так и на сентимент (слева).
- Более высокий % → профили распространяются дальше в соседние бары
- Более низкий % → компактный профиль близко к центру блока
Хорошие стартовые значения: 35–50%.
5. Show Liquidity Profile
Группа: Отображение
Включает или выключает распределение объема (профиль ликвидности) (справа от каждого блока).
- Вкл ✅
-
- Длина каждой строки отражает относительный объем торговли на этом ценовом уровне.
- Цвет кодирует высокие / средние / низкие торгуемые узлы.
- Выкл ❌
-
- Показывается только сентимент (если включен), справа бары объема не отображаются.
6. Show Sentiment Profile
Группа: Отображение
Включает или выключает профиль сентимента (слева от каждого блока).
- Вкл ✅
-
- Строки окрашены:
-
- Бычий (доминирование покупателей) – например, аква/зеленый
- Медвежий (доминирование продавцов) – например, красный
- Длина строки отражает силу доминирования.
- Выкл ❌
-
- Показывается только чистое распределение ликвидности/объема.
Используйте это, если хотите видеть не только где торгуется объем, но и кто был более активен на этих уровнях.
7. High Traded Threshold %
Группа: Отображение
Определяет порог для узлов с высоким объемом (HVN) внутри каждого блока.
- Выражается в виде % от максимального объема строки в блоке.
- Пример: максимальный объем строки = 10 000; порог = 70% → строки с объемом ≥ 7 000 считаются HVN.
HVN часто обозначают:
- зоны стоимости,
- зоны консолидации,
- области сильного позиционирования / справедливой стоимости.
8. Low Traded Threshold %
Группа: Отображение
Определяет порог для узлов с низким объемом (LVN) относительно максимального объема блока.
- Строки с объемом ниже этого процента считаются зонами низкой активности.
- Они могут выступать в роли:
-
- карманов тонкой ликвидности,
- потенциальных уровней отторжения,
- или зон, через которые цена склонна быстро проходить.
Типичное использование: 15–30%.
9. Show Level of Significance (POC)
Группа: Отображение
Показывает или скрывает точку контроля (POC) для самого последнего блока.
- POC = ценовая строка с наибольшим объемом торговли в этом блоке.
- Отображается в виде горизонтальной линии на этой цене. 🎯
Полезно как:
- ориентир для возврата к среднему,
- внутридневной якорь «справедливой цены»,
- или ключевой уровень для управления сделками.
10. Show Profile Price Levels
Группа: Отображение
Отображает текстовые метки для:
- Profile High (PH) – самая высокая цена, достигнутая в блоке
- Profile Low (PL) – самая низкая цена, достигнутая в блоке
Метки показываются для самого последнего блока и включают точные значения цены.
Отлично подходит для:
- быстрого чтения текущего диапазона,
- установки стопов/целей вокруг PH/PL,
- контекста для пробоев или ротаций.
11. Profile Range Background
Группа: Отображение
Рисует полупрозрачный фон в виде прямоугольника, покрывающего для каждого блока:
- временной диапазон (от начального до конечного бара)
- ценовой диапазон (от минимума до максимума)
Это визуально отделяет блоки и выделяет каждый диапазон.
Отключите, если предпочитаете более чистый, минималистичный вид.
12. Bars Opacity %
Группа: Отображение
Контролирует, насколько прозрачными или яркими являются прямоугольники (как бары ликвидности, так и сентимента).
- 20–40% → очень светлые, фоновые
- 50–70% → сбалансированная видимость, свечи всё ещё легко видны
- 80–100% → яркие, почти полностью непрозрачные блоки
Внутренне это значение преобразуется в альфа-канал (0–255) для цветов баров.
Рекомендуемый стартовый шаблон ⭐
Для индексов / фьючерсов внутридневных (M5–M15):
- Bars In Profile: 80–120
- Blocks To Show: 2–3
- Number of Rows: ~20
- Profile Width %: 35–45
- Show Liquidity Profile: true
- Show Sentiment Profile: true
- Bars Opacity %: 50–65
Сводка
Key features include:
- Liquidity Profile (right side): Displays trading volume concentration at each price level within a block, highlighting high-volume nodes (HVNs), low-volume nodes (LVNs), and average-volume nodes. Bar length corresponds to relative traded volume, and colors indicate volume intensity.
- Sentiment Profile (left side): Shows buyer vs. seller dominance per price level, calculated as twice the bullish volume minus total volume. Positive values indicate buy-side control; negative values indicate sell-side control. Bar length reflects the strength of dominance, with color coding for bullish (green/teal) and bearish (red) sentiment.
- Configurable parameters: number of bars per profile block, number of blocks displayed, vertical resolution (rows), profile width, opacity, and thresholds for defining HVNs and LVNs.
- Additional display options: Point of Control (POC) line for highest volume price in the latest block, profile high/low price labels, and background shading for block ranges.
DMD supports analysis across various markets including indices, commodities, forex, and cryptocurrencies, facilitating identification of trading activity concentration, liquidity zones, and market sentiment shifts within customizable timeframes.
Отзывы покупателей
5 | 0 % | |
4 | 100 % | |
3 | 0 % | |
2 | 0 % | |
1 | 0 % |


![Логотип продукта "Gaussian Channel [Iridio Capital]"](https://cdn.ctrader.com/image/webp/7c039209-5573-4a54-a072-f9528b503103_41960)