
Описание
Volume Bubbles – пользовательский индикатор cTrader
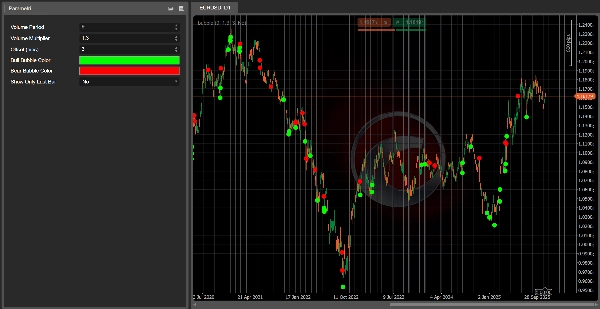
Volume Bubbles — это легкий, но мощный визуальный индикатор для cTrader, который выделяет свечи с исключительным объемом прямо на ценовом графике.
Вместо того чтобы смотреть на гистограмму объема и пытаться угадать, какие бары действительно важны, этот инструмент автоматически определяет, когда объем текущей свечи значительно выше недавнего среднего, и рисует пузырь (иконка круга) на этом баре:
- Для бычьих свечей пузырь рисуется ниже минимума свечи.
- Для медвежьих свечей пузырь рисуется выше максимума свечи.
Это значительно упрощает обнаружение потенциальных климаксных движений, зон сильного интереса крупных игроков или возможных точек истощения тренда.
Основные характеристики
- ✅ Определяет свечи с высоким объемом с помощью скользящей средней объема тиков
- ✅ Рисует четкие пузыри на графике (не требуется дополнительное подокно)
- ✅ Разные цвета для бычьих и медвежьих всплесков объема
- ✅ Регулируемый сдвиг в пунктах для позиционирования пузырей вдали от свечи
- ✅ Опция показывать пузыри только на последнем баре (для торговли в реальном времени)
Входные данные / Параметры
- Период объема – количество баров, используемых для скользящей средней объема.
- Множитель объема – во сколько раз объем бара должен превышать средний, чтобы вызвать появление пузыря.
- Сдвиг (пункты) – расстояние между пузырем и максимумом/минимумом свечи.
- Цвет пузыря быков – цвет пузырей на бычьих свечах.
- Цвет пузыря медведей – цвет пузырей на медвежьих свечах.
- Показывать только последний бар – если true, отображает пузыри только на текущем живом баре.
Как использовать
Добавьте Volume Bubbles на ваш график и используйте его как визуальный фильтр для:
- Подтверждения пробоев, поддержанных сильным объемом
- Обнаружения возможных разворотов или свечей истощения
- Определения зон, где могут быть активны крупные игроки
Это не самостоятельная торговая система, но отличный вспомогательный инструмент для любой стратегии, основанной на ценовом действии или следовании за трендом, которая учитывает объем.
👉 Присоединяйтесь здесь: Algotrendit Volume Bubbles
Внутри сервера вы найдете:
- Поддержку этого и других cBots/индикаторов
- Обсуждение стратегий и идеи по оптимизации
- Обновления, новости и будущие инструменты, которые я выпускаю
Сводка
Key features include adjustable parameters such as the volume period for averaging, volume multiplier threshold, bubble offset in pips, and customizable colors for bullish and bearish volume spikes. Users can also choose to display bubbles only on the latest bar for real-time trading. The indicator integrates directly on the price chart without requiring additional subwindows.
Volume Bubbles serves as a visual filter to confirm breakouts supported by strong volume, spot possible reversals or exhaustion candles, and identify zones of significant market activity. It complements price action and trend-following strategies by providing volume-based insights across various markets including forex, indices, commodities, stocks, and cryptocurrencies.
Отзывы покупателей
5 | 0 % | |
4 | 100 % | |
3 | 0 % | |
2 | 0 % | |
1 | 0 % |


