
Breakout channel
Индикатор
525 скачивания
Версия 1.0, Nov 2025
Windows, Mac
Описание
Каналы прорыва
Что это делает
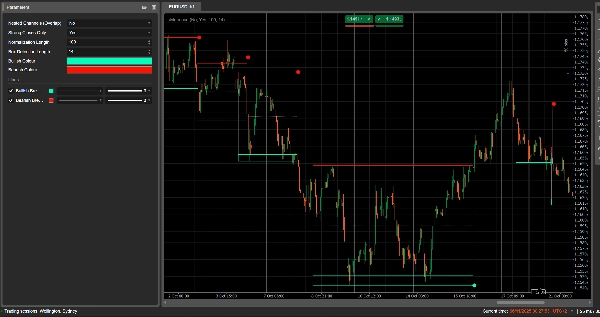
Каналы прорыва автоматически обнаруживают диапазоны консолидации (ценовые «коробки») и отмечают точки прорыва, когда цена выходит за эти диапазоны.
Он рисует:
- Серую коробку канала вокруг зоны консолидации
- Красную верхнюю границу (потенциальное сопротивление)
- Зеленую нижнюю границу (потенциальная поддержка)
- Белую пунктирную среднюю линию (середина канала)
- Цветные точки при прорыве:
-
- Зеленая/голубая точка под коробкой → бычий прорыв
- Красная точка над коробкой → медвежий прорыв
Идея заключается в визуальном выделении областей, где цена сжимается, и где вероятны сильные движения при выходе из диапазона.
Как это рассчитывается
- Нормализация цены
-
- За последние Normalization Length баров он находит максимальный максимум и минимальный минимум.
- Он нормализует закрытие в диапазон 0–1:
normalizedPrice=Close−LowestLowHighestHigh−LowestLow\text{normalizedPrice} = \frac{\text{Close} - \text{LowestLow}}{\text{HighestHigh} - \text{LowestLow}}normalizedPrice=HighestHigh−LowestLowClose−LowestLow
- Измерение волатильности
-
- Он вычисляет стандартное отклонение нормализованной цены за 14 баров.
- Это дает серию волатильности, используемую для обнаружения поворотных точек в структуре рынка.
- Верхние / Нижние «линии волатильности»
-
- За последние (Box Detection Length + 1) баров он находит:
-
- бар с максимальной волатильностью
- бар с минимальной волатильностью
- Исходя из того, сколько баров назад произошли эти экстремумы, строятся две синтетические линии: Верхняя и Нижняя.
- Пересечения между этими линиями сигнализируют о потенциальном начале/окончании фазы канала.
- Начало и продолжительность канала
-
- Когда Нижняя линия пересекает Верхнюю сверху вниз, индикатор отмечает потенциальное начало канала.
- С этого бара он отслеживает продолжительность и максимальный максимум / минимальный минимум за период.
- Создание канала
-
- Когда позже Верхняя линия пересекает Нижнюю снизу вверх, и продолжительность больше 10 баров:
-
- Он определяет верхнюю границу канала Top как максимальный максимум за этот период.
- Он определяет нижнюю границу канала Bottom как минимальный минимум.
- Он измеряет текущий ATR/2 для выделения тонкой зоны вверху и внизу:
-
- Красная полоса вверху (медвежья полоса)
- Зеленая полоса внизу (бычья полоса)
- Он рисует:
-
- Серый контурный прямоугольник (весь канал)
- Красный верхний контур
- Зеленый нижний контур
- Белую пунктирную среднюю линию через центр
- Каналы остаются на графике как историческая структура (они не удаляются после прорыва).
- Обнаружение прорыва
-
- Для каждого активного канала при каждом новом баре рассчитывается референтная цена:
-
- Если Strong Closes Only = true → используется середина тела свечи:
refPrice=(Open+Close)/2\text{refPrice} = (\text{Open} + \text{Close})/2refPrice=(Open+Close)/2
Для этого более половины тела должно быть за пределами коробки. - Если Strong Closes Only = false → используется простое закрытие.
- Если Strong Closes Only = true → используется середина тела свечи:
- Правила прорыва:
-
- Если
refPrice > Top→ бычий прорыв -
- Отмечает зеленую точку у нижней границы канала Bottom.
- Деактивирует этот канал (прекращает его расширение), но коробка остается видимой.
- Если
refPrice < Bottom→ медвежий прорыв -
- Отмечает красную точку у верхней границы канала Top.
- Деактивирует канал.
- В противном случае канал остается активным, и его правая граница расширяется до текущего бара.
- Если
- Опция вложенных каналов
-
- Если Nested Channels = true, несколько каналов могут перекрываться по времени и цене.
- Если false, индикатор блокирует создание нового канала, который перекрывался бы с существующим.
Как читать и использовать
- Серая коробка (канал)
-
- Представляет собой зону консолидации / баланса, где цена торговалась некоторое время.
- Чем длиннее и выше коробка, тем значительнее диапазон.
- Красная верхняя граница (зона сопротивления)
-
- Верхняя часть канала, визуально выделенная как потенциальная зона сопротивления.
- Повторяющиеся отказы у этой границы указывают на давление продавцов внутри диапазона.
- Зеленая нижняя граница (зона поддержки)
-
- Нижняя часть канала, выделенная как потенциальная поддержка.
- Повторяющиеся отскоки указывают на защиту нижней границы диапазона покупателями.
- Белая пунктирная средняя линия
-
- Это середина канала – своего рода локальная «справедливая цена».
- Колебания цены вокруг этой линии указывают на баланс; сильные движения в сторону часто предшествуют тесту противоположной границы.
- Точки прорыва
-
- Зеленая точка под коробкой:
-
- Цена сильно закрылась выше верхней границы канала (или просто закрылась выше, в зависимости от Strong Closes Only).
- Это указывает на бычий прорыв – потенциальное начало восходящего движения после сжатия волатильности.
- Красная точка над коробкой:
-
- Цена сильно закрылась ниже нижней границы канала.
- Это указывает на медвежий прорыв – потенциальное начало нисходящего движения.
- Типичные способы использования (на уровне идеи)
-
- Трендовые прорывы
-
- Торгуйте в направлении прорыва (покупайте после зеленой точки, продавайте после красной), желательно в сочетании с трендом на более высоком таймфрейме или другими индикаторами.
- Фильтр и подтверждение
-
- Используйте канал и его прорыв только как фильтр для вашей существующей стратегии (например, входите в длинные позиции только если последний сигнал был бычьим прорывом).
- Размещение риска
-
- Для бычьих прорывов многие трейдеры размещают стопы внутри или чуть ниже бывшего канала; для медвежьих – внутри или выше коробки.
Сводка
ИИ-сводка
Breakout Channels is a technical indicator designed to identify consolidation zones and signal potential price breakouts. It automatically detects price ranges where the market is coiling, marking these with a grey channel box that highlights the consolidation area. The indicator draws a red upper band indicating potential resistance, a green lower band indicating potential support, and a white dotted midline representing the channel midpoint or local fair value.
Breakout points are signaled by colored dots: a green or cyan dot below the box indicates a bullish breakout, while a red dot above signals a bearish breakout. The indicator calculates these zones by normalizing price data, measuring volatility through the standard deviation of normalized prices, and identifying volatility extremes to define channel start and duration.
Channels remain visible on the chart as historical structures even after breakouts. Users can enable nested channels to allow overlapping consolidation zones. Breakout detection uses either candle body midpoints or close prices, depending on settings, to confirm strong closes outside the channel.
Typical uses include trading in the breakout direction, filtering existing strategies, and placing risk stops near channel boundaries. The indicator supports various markets including forex, indices, commodities, stocks, and cryptocurrencies.
Профиль индикатора
Отзывы покупателей
0.0
Отзывы: 0
Отзывы покупателей
У этого продукта еще нет отзывов. Уже попробовали его? Поделитесь впечатлениями!
Обсуждение
Частые вопросы
Signal
Indices
Commodities
GBPUSD
RSI
Bollinger
Fibonacci
Scalping
AI
XAUUSD
NAS100
MACD
BTCUSD
Forex
Breakout
EURUSD
NZDUSD
Martingale
Prop
ZigZag
Supertrend
Fair Value Gap
SMC
Crypto
Grid
Stocks
ATR
USDJPY
VWAP
Продукты, доступные в cTrader Store, включая торговых ботов, индикаторы и плагины, предоставляются сторонними разработчиками и доступны исключительно в информационных и технических целях. cTrader Store не является брокером и не предоставляет инвестиционные консультации, персональные рекомендации или какие-либо гарантии будущей доходности.


![Логотип продукта "[Stellar Strategies] Market Regime Filter"](https://cdn.ctrader.com/image/webp/3bdeba11-7e8b-4e5f-9af9-d562f48df039_28423)


Цена
42.11M
Торгуемый объем
6.13M
Выигранные пипы
230
Продажи
8.52K
Бесплатные установки