
Описание
Liquidity Cluster Order (LCO) 🔍💧
1. Что показывает LCO
Liquidity Cluster Order автоматически обнаруживает и отображает:
- Бычьи кластеры ликвидности (потенциальные зоны спроса / накопления) ✅
- Медвежьи кластеры ликвидности (потенциальные зоны предложения / распределения) 🔻
Каждый кластер:
- привязан к свечному бару с пивотом объема (локальный максимум объема),
- классифицируется как бычий или медвежий на основе недавнего ценового движения,
- продлевается вперед во времени до тех пор, пока цена не погасит (не израсходует) кластер.
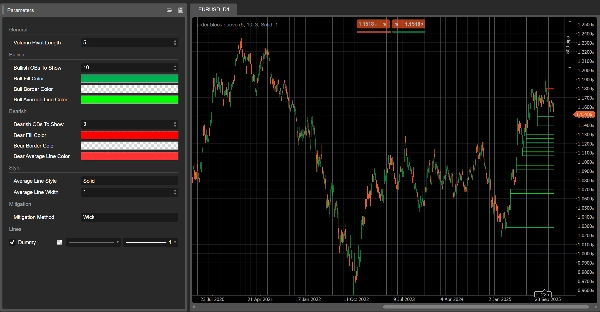
На графике вы видите:
- Зеленые прямоугольники → бычьи кластеры ликвидности
- Красные прямоугольники → медвежьи кластеры ликвидности
- Серая линия внутри каждого прямоугольника → средний ценовой уровень этого кластера
Как только кластер считается погашенным, он исчезает с графика, и остаются только активные кластеры.
2. Логика обнаружения (простыми словами)
- Пивот объема
-
- LCO ищет бары, где объем выше, чем у предыдущих и следующих
Volume Pivot Lengthбаров. - Эти бары являются пивотами объема – потенциальными якорями для кластеров ликвидности.
- LCO ищет бары, где объем выше, чем у предыдущих и следующих
- Контекст: бычий против медвежьего
-
- Недавнее поведение цены определяет контекст:
-
- Бычий контекст → доминировало движение вниз.
- Медвежий контекст → доминировало движение вверх.
- Этот контекст определяет, создаст ли следующий пивот объема бычий или медвежий кластер ликвидности.
- Бычий кластер ликвидности
В бычьем контексте: -
- Низ кластера = минимум пивот-бара
- Верх кластера = середина бара (
(high + low) / 2) - Интерпретация: зона, где давление снизу было поглощено и покупатели активно вошли в рынок.
- Медвежий кластер ликвидности
В медвежьем контексте: -
- Низ кластера = середина пивот-бара
- Верх кластера = максимум пивот-бара
- Интерпретация: зона, где давление сверху было поглощено и продавцы взяли контроль.
- Средняя линия
-
- Для каждого кластера LCO вычисляет среднее между верхом и низом и рисует серую среднюю линию.
- Это служит внутренним уровнем равновесия кластера.
- Погашение (поглощение кластера)
На каждом новом баре LCO проверяет, был ли кластер погашен: -
- Для бычьих кластеров:
-
- Отслеживается целевая цена вниз за последние
Volume Pivot Lengthбаров: -
Mitigation Method = Wick→ самый низкий минимум.Mitigation Method = Close→ самый низкий закрытие.
- Если эта целевая цена опускается ниже низа кластера, то бычий кластер считается погашенным и удаляется.
- Отслеживается целевая цена вниз за последние
- Для медвежьих кластеров:
-
- Отслеживается целевая цена вверх:
-
Wick→ самый высокий максимум.Close→ самое высокое закрытие.
- Если эта целевая цена поднимается выше верха кластера, то медвежий кластер считается погашенным и удаляется.
Погашенный = ликвидность в этом кластере считается поглощенной / недействительной.
3. Как читать LCO на графике
Вы увидите в основном:
- Зеленые кластеры ниже цены → потенциальные зоны спроса ликвидности
- Красные кластеры выше цены → потенциальные зоны предложения ликвидности
Типичное чтение (не торговый совет):
- Свежие кластеры
-
- Недавно созданные кластеры часто более актуальны:
-
- Бычий кластер ниже цены → зона, где покупатели в последний раз поглощали давление продавцов.
- Медвежий кластер выше цены → зона, где продавцы в последний раз поглощали давление покупателей.
- Повторные тесты кластера
-
- Цена возвращается к бычьему кластеру сверху:
-
- Если цена реагирует и удерживает низ → возможная отскок / зона реакции на лонг.
- Цена возвращается к медвежьему кластеру снизу:
-
- Если цена не может пробиться выше верха → возможный отбой / зона реакции на шорт.
- Погашенные и активные кластеры
-
- Когда цена пробивает кластер за его пределами согласно выбранному методу погашения,
→ этот кластер ликвидности удаляется на последующих барах. - Кластеры, которые остаются видимыми, являются активными зонами ликвидности, через которые еще не полностью прошла цена.
- Когда цена пробивает кластер за его пределами согласно выбранному методу погашения,
- Использование средней линии
-
- Эту серую среднюю линию можно использовать как:
-
- уровень фиксации прибыли или частичного выхода внутри кластера,
- ориентир «справедливой цены» внутри зоны ликвидности,
- быстрый способ увидеть, торгуется ли цена в верхней или нижней половине кластера.
4. Параметры (на английском)
Volume Pivot Length
- Бары, используемые для:
-
- обнаружения пивотов объема,
- вычисления экстремумов и целевой цены погашения.
- Низкие значения → больше кластеров, больше шума;
- Высокие значения → меньше, но более значимых кластеров.
Bullish Liquidity Clusters To Show
(бывшие Bullish OBs To Show)
- Максимальное количество отображаемых бычьих кластеров на графике.
Bearish Liquidity Clusters To Show
(бывшие Bearish OBs To Show)
- Максимальное количество отображаемых медвежьих кластеров.
Bull Fill Color / Bear Fill Color
- Цвет заливки бычьих/медвежьих кластеров.
- Можно использовать значения альфа-канала (прозрачности).
Bull/Bear Average Line Color
- Цвет внутренней средней линии для каждого кластера.
Average Line Style
- Визуальный стиль средней линии:
"Solid","Dashed","Dotted".
Average Line Width
- Толщина средней линии.
Mitigation Method
"Wick"→ погашение на основе верхних/нижних теней (более чувствительный)."Close"→ погашение на основе цен закрытия (более консервативный).
Сводка
On the chart, bullish clusters appear as green rectangles below the price, indicating areas where buyers absorbed selling pressure. Bearish clusters are shown as red rectangles above the price, marking zones where sellers absorbed buying pressure. Each cluster includes a grey mid-line representing the average price level, serving as an internal equilibrium reference.
Clusters extend forward in time until price "mitigates" or consumes them, at which point they disappear, leaving only active liquidity zones visible. Mitigation is determined by tracking price extremes (high/low wicks or closing prices) over a configurable number of bars.
Key parameters include the volume pivot length (defining sensitivity and cluster significance), maximum clusters displayed, cluster colors, mid-line style, and mitigation method. LCO supports various markets including forex, indices, commodities, stocks, and cryptocurrencies, and integrates with multiple trading strategies and indicators such as RSI, MACD, Bollinger Bands, and Fibonacci levels.
Отзывы покупателей
5 | 100 % | |
4 | 0 % | |
3 | 0 % | |
2 | 0 % | |
1 | 0 % |


