
Описание
Импульс машинного обучения KNN Перестаньте отставать. Начните прогнозировать. Аналитика K-Nearest Neighbors институционального уровня.
Параметры по умолчанию оптимизированы для XAUUSD. Работает на любом таймфрейме — выбирайте в зависимости от вашего стиля торговли. Более высокие таймфреймы дают более чистые сигналы с большей вероятностью. Более низкие таймфреймы генерируют больше сигналов с небольшим увеличением шума. См. руководство по таймфреймам ниже.
🥈 Также доступна: Автоматизированная версия бота для XAGUSD Нравится логика? Идите дальше. Специальная версия бота для этого индикатора — специально настроенная для XAGUSD (Серебро) — доступна на маркетплейсе. Работает полностью автоматически, выполняя сделки от вашего имени без необходимости ручного ввода. Стоимость низкая относительно ожидаемой доходности.
👉 KNN XAGUSD Bot — Просмотр на cTrader Market
⏱ Руководство по таймфреймам
ТаймфреймОбъем сигналовПримечания
M5
Очень высокий
Больше шума — требует более строгой дисциплины и фильтрации, чтобы избежать переизбытка сделок.
M8
Высокий (ПО УМОЛЧАНИЮ)
Оптимизированная базовая настройка. Лучший баланс между частотой сигналов и точностью для XAUUSD.
M15
Средний
Более чистые, высококачественные сигналы с меньшим количеством входов за сессию.
M30 / H1
Низкий
Максимальная точность — лучше всего подходит для свинг-стиля с большей терпеливостью.
Параметры по умолчанию были протестированы на M8. При смене таймфрейма рассмотрите возможность корректировки периода ATR и множителей SL/TP соответственно.
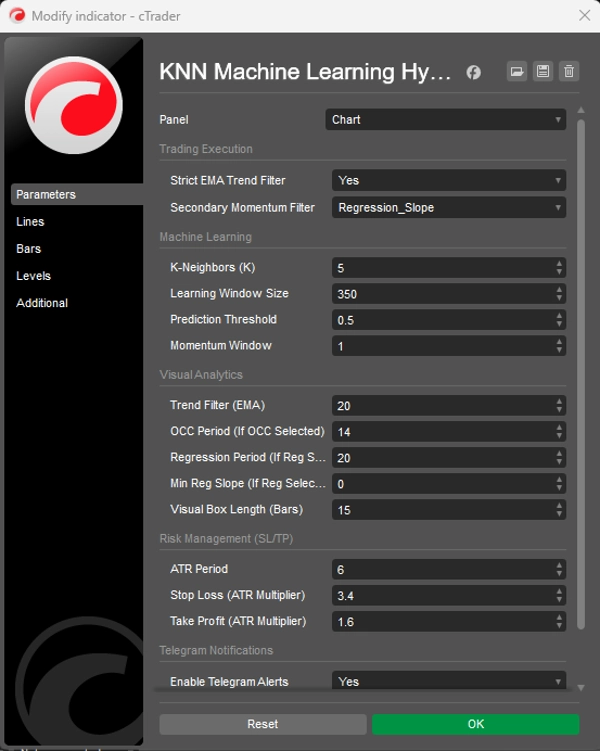
⚙️ Параметры по умолчанию
Окно обучения (350) — Количество исторических свечей, которые движок KNN сканирует для поиска совпадений паттернов.
Порог предсказания (0.5) — Минимальный уровень уверенности, необходимый для генерации сигнала.
Период ATR (6) — Период, используемый для расчёта Average True Range для определения размеров SL/TP.
Множитель Stop Loss (3.4) — Расстояние SL = ATR × 3.4. Шире, чтобы дать волатильности золота пространство для дыхания.
Множитель Take Profit (1.6) — Расстояние TP = ATR × 1.6. Уже, чтобы быстро зафиксировать прибыль и поддерживать высокий процент выигрышных сделок.
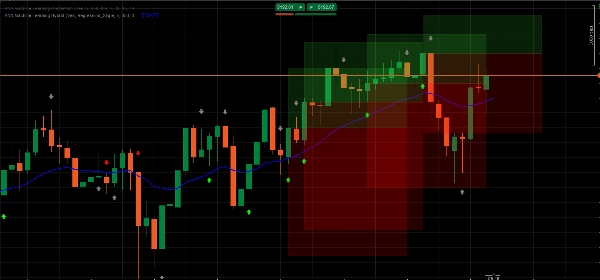
Фильтр тренда EMA (20) — Период EMA, используемый как фильтр тренда — синяя линия на вашем графике.
🤖 Прогностический движок KNN Сжимает отклонения RSI и MA в алгоритм исторического сопоставления. На каждой свече сканирует последние 350 баров и находит 5 наиболее похожих моментов в прошлом для прогнозирования направления.
📈 Строгий фильтр тренда EMA Автоматически подавляет маловероятные контртрендовые сигналы. Высоковероятными считаются только сигналы, совпадающие с общим трендом.
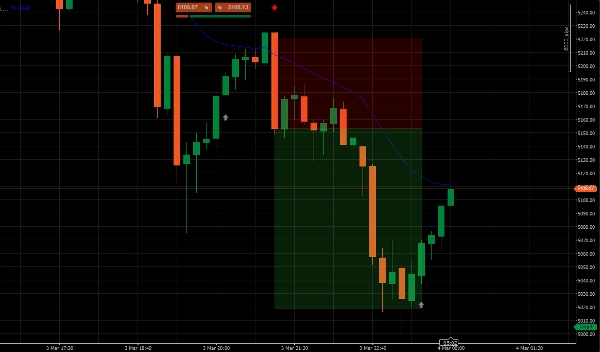
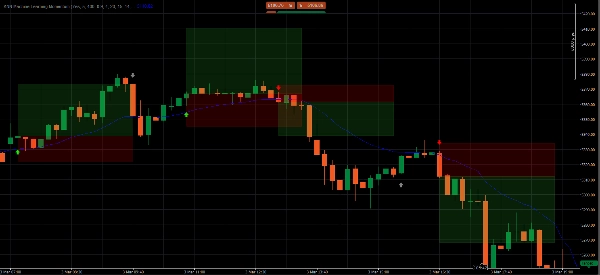
📦 Динамические целевые зоны ATR Проецирует прозрачные цветные зоны для ваших уровней Take Profit и Stop Loss, адаптируясь в реальном времени к текущей волатильности рынка через ATR.
🧹 Менеджер памяти интерфейса Поддерживает чистоту вашего графика, автоматически удаляя старые зоны. В любой момент отображаются только 5 самых последних настроек.
📲 Push-уведомления в Telegram Встроенная интеграция webhook отправляет мгновенные торговые оповещения с точными ценами входа, TP и SL прямо на ваш телефон.
📊 Чтение сигналов
🟢 Ярко-зеленая стрелка — высоковероятная ПОКУПКА KNN прогнозирует рост цены И цена находится выше EMA. Полное совпадение с трендом. Это премиальные настройки для торговли.
🔴 Ярко-красная стрелка — высоковероятная ПРОДАЖА KNN прогнозирует падение цены И цена находится ниже EMA. Полное совпадение с трендом. Входите при закрытии свечи сигнала.
⚪ Серая стрелка — контртренд (НЕ ТОРГУЙТЕ) Обнаружено изменение импульса, но против общего тренда. Выводится только для информирования — значительно меньшая вероятность.
▶️ Руководство по исполнению
- Ждите ярко-зеленую или ярко-красную стрелку — полностью игнорируйте серые сигналы.
- Ждите полного закрытия свечи сигнала перед входом.
- Устанавливайте SL и TP на внешнем горизонтальном краю каждой зоны — краю, наиболее удалённом от вашей цены входа.
❓ Часто задаваемые вопросы
Почему появляется стрелка? Каждый бар алгоритм делает снимок текущего импульса RSI и MA, сканирует последние 350 баров для 5 наиболее математически похожих моментов и прогнозирует направление на основе того, куда цена пошла в этих моментах.
Чем яркая стрелка отличается от серой? Яркие стрелки = сигнал ИИ и тренд EMA полностью совпадают — максимальная вероятность. Серые стрелки = обнаружен импульс, но контртренд — отмечены как слишком рискованные для торговли.
Какой таймфрейм использовать? M8 — оптимизированный по умолчанию. Более высокие таймфреймы (M15, M30, H1) дают меньше, но более чистых сигналов. M5 даёт больше сигналов, но требует более строгой фильтрации.
Где именно ставить SL и TP? На внешнем горизонтальном краю каждой цветной зоны — краю, наиболее удалённом от вашей цены входа.
Можно ли использовать это на активах, кроме золота? Да — применимо к любым активам на cTrader. Однако параметры были протестированы специально для XAUUSD. Другие инструменты выиграют от периода настройки параметров.
⚠️ Отказ от ответственности по рискам Торговля на рынке форекс, товарами и CFD с использованием маржи несёт высокий уровень риска и может не подходить всем инвесторам. Этот индикатор является инструментом количественного анализа для образовательных и информационных целей — он не является финансовой консультацией. Прошлые результаты не гарантируют будущих. Всегда тестируйте на демо-счёте перед риском реального капитала.
Сводка
Key functionalities include dynamic Average True Range (ATR)-based stop loss and take profit target zones that adapt to market volatility, and a UI memory manager that keeps charts clear by displaying only the five most recent setups. Signals are visually represented by arrows: bright green for high-probability buy, bright red for high-probability sell, and gray for counter-trend momentum (not recommended for trading). The indicator supports multiple timeframes, with M8 as the default optimized setting balancing signal frequency and accuracy.
Additionally, it integrates Telegram push alerts via webhook, delivering real-time trade signals with precise entry, stop loss, and take profit levels. Users are advised to wait for signal candle closure before entering trades and to place stops and targets at the edges of the ATR target zones. Parameters such as learning window, prediction threshold, ATR period, and multipliers for stop loss and take profit are configurable to suit different trading styles.


![Логотип продукта "[Stellar Strategies] Linear Regression Candles 1.1"](https://cdn.ctrader.com/image/webp/8b9cff9f-2431-46d2-b0ec-c7f55f4a4a6d_27918)