
Описание
Демонстрация:
Индикатор Supertrend – незаменимый инструмент для трейдеров, который помогает легко следовать рыночным трендам и принимать более обоснованные инвестиционные решения! Этот интуитивно понятный индикатор профессионального уровня разработан для того, чтобы давать кристально четкие сигналы на покупку и продажу, независимо от того, новичок вы или опытный инвестор.
Почему стоит выбрать индикатор Supertrend?
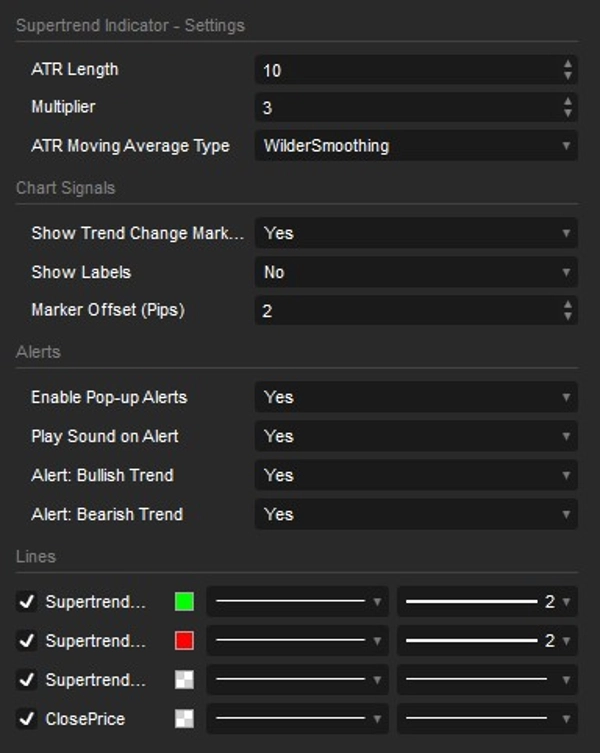
- Точность, соответствующая отраслевым стандартам: Теперь с настраиваемыми типами скользящих средних ATR (включая сглаживание Уайлдера). Он рассчитывается и реагирует точно так же, как самые популярные премиум-версии Supertrend, доступные на ведущих платформах для построения графиков, таких как TradingView!
- 100% без перерисовки: Создан с надежным механизмом запоминания тренда. Как только тренд меняется и появляется сигнал, он остается. Нет перерисовки, исчезающих стрелок и ошибок перерасчета при прокрутке истории графика.
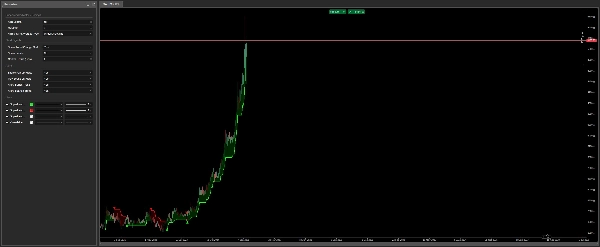
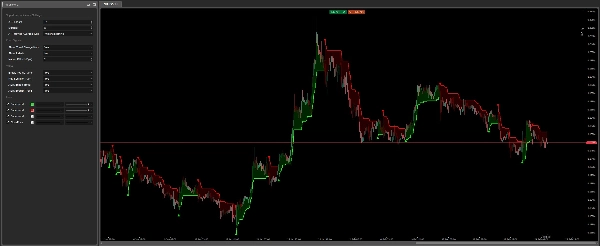
- Простота и эффективность: Индикатор автоматически рисует линию Supertrend, которая становится зеленой при росте рынка (сигнал на покупку) и красной при падении (сигнал на продажу). Вы всегда будете точно знать, в каком направлении движется тренд.
- Умные уведомления в реальном времени: Никогда не пропускайте торговую возможность! Индикатор оснащен усовершенствованной системой оповещений с использованием встроенных всплывающих окон cTrader и интегрированных звуковых эффектов. Кроме того, благодаря встроенной защите от спама, вы получаете уведомление ровно один раз при появлении сигнала в реальном времени — никакого надоедливого звукового спама при загрузке или перезагрузке графиков.
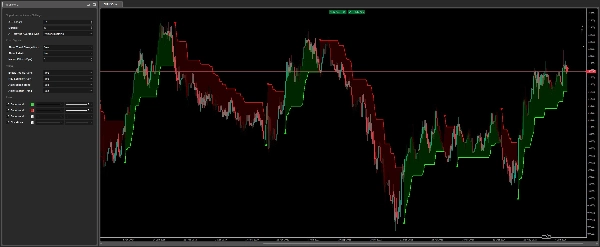
- Улучшенные визуальные сигналы и заливка облаком: При каждом ключевом изменении тренда вы увидите заметные стрелки и опциональные текстовые метки "Бычий"/"Медвежий". Тонкая динамическая заливка облаком между линией Supertrend и ценой помогает легко оценить рыночный импульс с первого взгляда.
- Полная настройка и точность: Легко регулируйте основные параметры, такие как длина ATR и множитель. Вы также можете точно контролировать расстояние стрелок и меток с помощью динамических смещений на основе пунктов, обеспечивая идеальную, не загроможденную визуализацию на любом активе.
Индикатор Supertrend идеально подходит для всех, кто хочет упростить анализ рынка — от начинающих трейдеров, ищущих простой способ выявлять тренды, до опытных профессионалов, желающих получать высокоточные сигналы без перерисовки для своих стратегий. Он безупречно работает на любом рынке — Форекс, акции, индексы, криптовалюты — и на всех таймфреймах.
Сводка
Отзывы покупателей
5 | 33 % | |
4 | 67 % | |
3 | 0 % | |
2 | 0 % | |
1 | 0 % |


![Логотип продукта "[CB] Pivot Points Pro"](https://cdn.ctrader.com/image/webp/43463c82-67b0-4f10-a4ba-901bba091d81_32594)


