
Описание
Что такое индикатор трендовой линии?
Индикатор трендовой линии — это инструмент технического анализа, используемый трейдерами и аналитиками для определения направления и силы тренда на финансовом рынке. Он основан на проведении прямой линии, соединяющей две или более ценовых точки на графике. Основная цель трендовой линии — визуально представить общее направление движения цены за определённый период.
Индикатор трендовой линии с несколькими таймфреймами
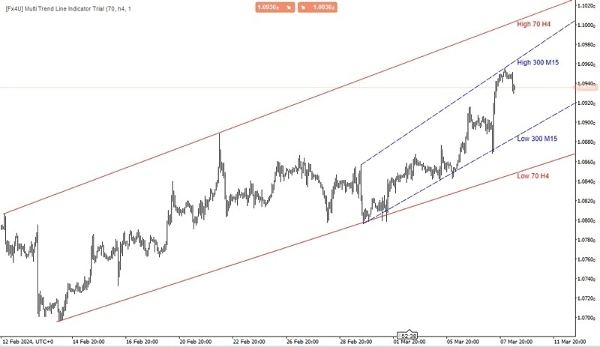
Основная функция индикатора трендовой линии с несколькими таймфреймами — предоставить трейдерам более широкий взгляд на рыночные тренды, агрегируя информацию с различных таймфреймов. Анализируя тренды на нескольких таймфреймах, трейдеры могут принимать более обоснованные решения о потенциальных точках входа и выхода, а также об общем направлении рынка.
Этот тип индикатора обычно позволяет трейдерам настраивать таймфреймы для анализа и соответственно строить трендовые линии. Он может быть ценным инструментом для определения ключевых уровней поддержки и сопротивления, разворотов тренда и продолжений тренда на разных таймфреймах, помогая трейдерам принимать более точные торговые решения.
Существует несколько типов трендовых линий, включая:
- Восходящая трендовая линия: Она проводится, соединяя два или более последовательных минимума на ценовом графике. Это указывает на восходящий тренд, показывая, что цены в целом растут со временем.
- Нисходящая трендовая линия: Напротив, нисходящая трендовая линия проводится, соединяя два или более последовательных максимума на ценовом графике. Это указывает на нисходящий тренд, показывая, что цены в целом падают со временем.
- Горизонтальная трендовая линия: Также известна как линии поддержки или сопротивления, эти линии проводятся горизонтально, чтобы указать области, где движение цены обычно замедляется или разворачивается.
Трейдеры часто используют трендовые линии в сочетании с другими техническими индикаторами и методами анализа для принятия обоснованных торговых решений. Когда трендовая линия пробивается или нарушается, это может указывать на потенциальное изменение направления тренда, предоставляя торговые сигналы для инвесторов.
Мои другие продукты:
https://ctrader.com/products/346
https://ctrader.com/products/336
https://ctrader.com/products/343
https://ctrader.com/products/347
https://ctrader.com/products/148
Сводка
This multi-timeframe indicator aggregates trend information across customizable timeframes, providing a comprehensive market overview. It supports the identification of upward, downward, and horizontal trendlines, which correspond to rising trends, falling trends, and support or resistance levels, respectively. By integrating trendlines from various timeframes, traders can better detect trend continuations, reversals, and key support/resistance zones.
The indicator assists in making informed trading decisions by highlighting potential entry and exit points based on trendline breaks or breaches. It is intended for use alongside other technical indicators and analysis methods to enhance market interpretation and trading accuracy.
Отзывы покупателей
5 | 67 % | |
4 | 0 % | |
3 | 33 % | |
2 | 0 % | |
1 | 0 % |
![Логотип продукта "[Fx4U] GBPUSD - Price Action"](https://cdn.ctrader.com/image/webp/d80b34fc-da3c-4f01-a321-456450665649_26190)

![Логотип продукта "[Fx4U] CADJPY - Price Action"](https://cdn.ctrader.com/image/webp/1ba81247-b6b7-4f3c-a297-fa3eb1d57fe1_26195)

![Логотип продукта "[Fx4U] AUDCHF - Price Action"](https://cdn.ctrader.com/image/webp/0a22e9aa-c83b-42cd-b0b8-c1a2da593207_26148)

![Логотип продукта "[Fx4U] EURAUD - Price Action"](https://cdn.ctrader.com/image/webp/baf8dde4-1ef3-4beb-8ae2-0fed8320f65d_26177)


![Логотип продукта "[Stellar Strategies] Market Session Ultimate"](https://cdn.ctrader.com/image/webp/61ffd537-0125-4246-9e72-42eca1791d64_28232)


