
Описание
Regime Filter Pro (+ Alerts)
Преобразуйте свою торговлю с помощью продвинутого анализа рыночных режимов
Устали от постоянных ложных сигналов на волатильных рынках? Трудно определить, когда тренды действительно сильны? Индикатор Regime Filter — ваше решение — мощный инструмент, который прорезает рыночный шум, чтобы показать истинную силу тренда и динамику объема.
🚀 Что делает этот индикатор особенным?
Построенный на основе сложной технологии Hull Moving Average (HMA) в сочетании с анализом объема, Regime Filter предоставляет кристально чистую визуализацию рыночных режимов от экстремально медвежьего (-10) до экстремально бычьего (+10). Больше никаких догадок — вы БУДЕТЕ ЗНАТЬ, в каком типе рынка торгуете.
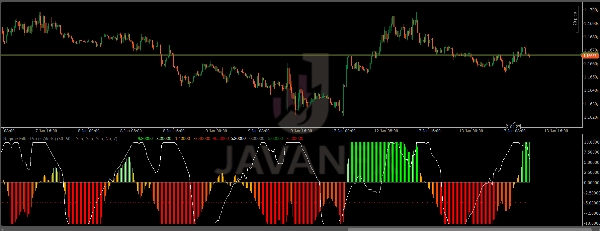
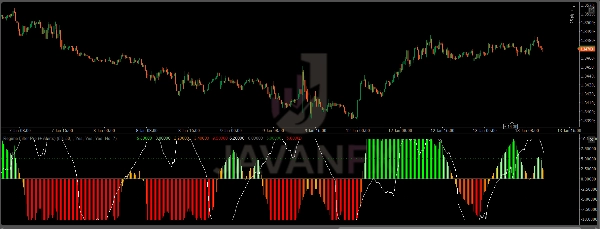
Индикатор оснащен многоцветной гистограммой тренда, которая делает анализ рынка легким. С пятью различными цветовыми зонами вы можете мгновенно определить точную силу тренда. Когда вы видите лаймово-зеленый цвет, это сильный бычий рынок с значениями от 7 до 10. Светло-зеленый указывает на слабую бычью фазу от 3 до 7. Оранжевая зона представляет нейтральную территорию от -3 до 3, где следует проявлять крайнюю осторожность. По мере ухудшения условий оранжево-красный сигнализирует о слабом медвежьем рынке от -7 до -3, а красный — о сильном медвежьем рынке от -10 до -7.
Что отличает этот индикатор, так это линия подтверждения объема. В отличие от других индикаторов тренда, которые могут давать ложные сигналы, Regime Filter включает отдельный анализ тренда объема, который предотвращает попадание в слабые движения. Вы всегда будете знать, когда тренд имеет реальный импульс, и сможете заметить опасные расхождения между ценовым трендом и объемом до того, как они нанесут ущерб вашему счету.
Умная система оповещений — еще одно революционное новшество. Индикатор активно отслеживает сильные бычьи и медвежьи условия, когда тренд и объем идеально совпадают. Он предупреждает вас о разворотах тренда, когда цена пересекает критическую нулевую линию. Возможно, самое важное — он обнаруживает изменения режима, когда весь характер рынка меняется с одного состояния на другое. Каждый порог полностью настраивается под ваш стиль торговли и уровень риска.
💡 Как использовать этот индикатор
Для трейдеров трендов
Если вы трейдер трендов, Regime Filter станет вашим лучшим помощником. Стратегия элегантно проста, но мощно эффективна. Входите в длинные позиции, когда значение тренда превышает +5, а индикатор объема положителен. Эта комбинация говорит вам, что тренд не только движется вверх, но и поддерживается объемом для устойчивого движения. Напротив, входите в короткие позиции, когда тренд опускается ниже -5 при положительном подтверждении объема. Прелесть этого подхода — точное понимание момента выхода — как только тренд приближается к нулю или вы замечаете расхождение объема с ценовым движением, пора фиксировать прибыль и отходить в сторону.
Для свинг-трейдеров
Свинг-трейдеры найдут огромную ценность в ожидании экстремальных условий режима. Когда значение тренда достигает ±7 или выше, вы наблюдаете рынок в полном импульсе. Это условия, при которых свинг-сделки имеют наивысшую вероятность успеха. Ключ — терпение — ждите развития этих экстремальных зон, убедитесь в подтверждении объема, затем входите на откатах внутри сильного трендового режима. Ваше тайминг значительно улучшится, потому что вы не боретесь с доминирующей рыночной силой. Используйте изменения режима как сигнал для фиксации прибыли. Когда цвет меняется с сильного на слабый, рынок сообщает вам о смене характера.
Для скальперов
Скальперам нужно быть еще более избирательными с Regime Filter. Золотое правило скальпинга — торговать только в сильных режимах, представленных лаймовыми или красными зонами. Это единственные моменты, когда рыночный импульс достаточен для быстрых входов и выходов. Как только цвет меняется на слабые зоны, выходите немедленно. Никогда не скальпируйте в нейтральной оранжевой зоне — это периоды консолидации, где спрэд и хаос съедают вашу прибыль. Для лучших результатов используйте более низкие таймфреймы, такие как M1, M5 или M15, где изменения режима происходят чаще и дают вам множество возможностей в течение дня.
🎓 Профессиональные торговые советы
Понимание подтверждения на нескольких таймфреймах критично для успеха с Regime Filter. Перед тем как совершать сделку на основном таймфрейме, всегда проверяйте режим на более высоком таймфрейме. Если вы торгуете на 15-минутном графике, проверьте режим на 1-часовом или 4-часовом. Направление вашей сделки должно совпадать с режимом на более высоком таймфрейме. Это простое правило спасет вас от множества убыточных сделок, когда вы боретесь с общей картиной.
Дивергенция объема — один из самых мощных сигналов, которые может дать Regime Filter. Когда вы видите, что значение тренда показывает силу, но линия объема падает, готовьтесь к возможному развороту или периоду консолидации. Рынок сообщает вам, что меньше участников поддерживают это движение, и оно, вероятно, теряет импульс. Умные трейдеры используют это как систему раннего предупреждения, чтобы либо ужесточить стопы, либо частично зафиксировать прибыль.
Обратите особое внимание на зоны перехода режимов. Некоторые из самых прибыльных движений в торговле происходят, когда рынок переходит из нейтрального в сильный режим. Установите оповещения на эти моменты и будьте готовы к действию. Когда вы получаете сигнал, что режим сменился с оранжевого (нейтрального) на лаймовый (сильный бычий), вы ловите начало возможного устойчивого тренда. Именно в этих переходах создаются состояния для больших заработков.
Сочетание анализа режима с уровнями поддержки и сопротивления создает мощный торговый подход. Используйте Regime Filter для определения направленной склонности, затем терпеливо ждите, пока цена достигнет ключевых уровней перед входом. Сильный бычий режим в сочетании с тестом важного уровня поддержки создает высоковероятный лонг-сетап. Аналогично, сильный медвежий режим при встрече с сопротивлением — ваш сигнал для шортов.
Управление рисками должно адаптироваться к текущему режиму. Во время слабых или нейтральных режимов уменьшайте размер позиции или полностью оставайтесь вне рынка. Это не время для агрессивных действий. Сохраняйте большие позиции для сильных режимов с подтверждением объема. Такой динамический подход к размеру позиции может кардинально изменить ваши результаты.
Наконец, научитесь избегать хаоса. Когда и индикатор тренда, и объем находятся около нуля, рынок говорит вам держаться подальше. Это периоды консолидации без направленной уверенности. Терпение в эти моменты — не пассивность, а активный выбор сохранить капитал и дождаться ясности режима.
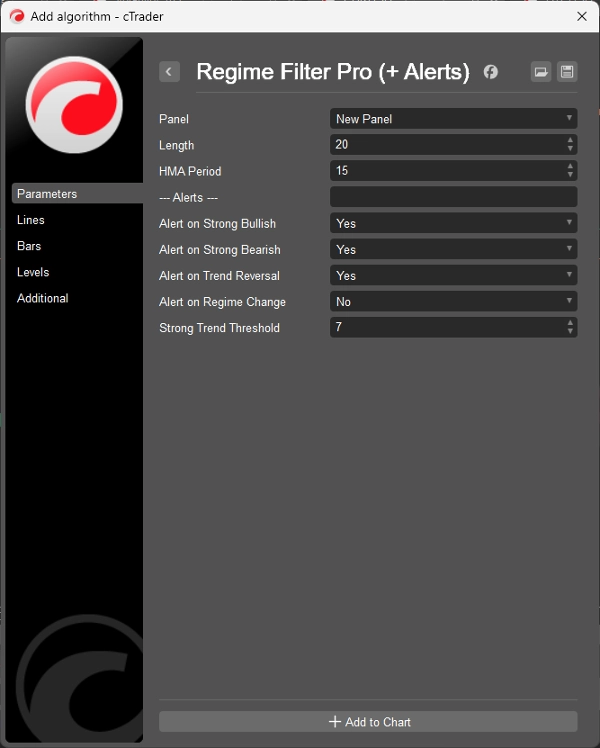
📈 Руководство по оптимальным настройкам
Для дневной торговли на таймфреймах M5–M15 используйте более отзывчивые настройки. Установите параметр Length между 15 и 20, период HMA — от 10 до 15, а порог Strong Threshold около 6–7. Эти настройки помогут вам ловить внутридневные изменения режима без излишнего шума.
Свинг-трейдерам, работающим на графиках H1–H4, следует увеличить параметры для большей стабильности. Length от 20 до 30 в сочетании с периодом HMA 15–20 работает отлично. Поднимите порог Strong Threshold до 7 или 8, чтобы торговать только самыми надежными свинг-сетапами.
Позиционным трейдерам, смотрящим на дневные графики, нужны еще более устойчивые настройки. Используйте Length от 25 до 35, период HMA 20–25 и порог Strong Threshold 7–9. Эти настройки фильтруют дневной шум и показывают только значимые изменения режима, важные для долгосрочных позиций.
Если вы торгуете волатильные рынки, такие как криптовалюты, вам нужно адаптироваться. Уменьшите Length на 5–10 пунктов от стандартных настроек, чтобы успевать за более быстрым темпом крипторынков. Оставьте период HMA стандартным, но увеличьте порог Strong Threshold до 8 или 9, чтобы избежать ложных сигналов в условиях волатильности.
🎨 Понимание визуализации
Когда вы открываете окно индикатора Regime Filter, вы увидите несколько ключевых компонентов, работающих вместе. Основная гистограмма — это индикатор силы тренда, окрашенный в соответствии с текущим режимом. Белая линия, проходящая через окно, — это подтверждение тренда объема — внимательно следите за ней, так как она может подтвердить или предупредить о сигналах гистограммы. Серая линия на нуле — ваша точка отсчета, разделяющая бычью территорию сверху и медвежью снизу. Наконец, пунктирные линии на +5 и -5 обозначают пороговые зоны, где режимы переходят от слабого к сильному.
Чтение графика становится интуитивным с практикой. Любой столбец гистограммы выше нуля указывает на доминирование бычьего давления на рынке. Столбцы ниже нуля сигнализируют о медвежьем давлении. Расстояние от нуля показывает силу тренда — чем дальше, тем сильнее убежденность. Положение белой линии объема добавляет критический контекст — когда она растет вместе с гистограммой, у вас есть подтверждение. Когда она расходится, это предупреждение.
⚡ Реальные торговые сценарии
Позвольте провести вас через три реальные торговые ситуации, чтобы показать, насколько мощным может быть этот индикатор на практике.
В первом сценарии представьте, что рынок консолидировался в нейтральной оранжевой зоне последние два часа. Вы терпеливо ждали, не форсируя сделки. Внезапно значение тренда прыгает с +1 до +8, твердо в лаймовой зоне, а объем одновременно поднимается до +3. Ваш сигнал срабатывает мгновенно. Это ваш сигнал — сразу входите в лонг. Режим резко изменился, и тренд с объемом подтверждают движение. Вы следите за трендом, внимательно наблюдая за цветами, и когда гистограмма начинает смещаться к светло-зеленому, фиксируете прибыль. Это подтверждение прорыва в лучшем виде.
Второй сценарий связан с обнаружением разворота. Вы наблюдали жесткий медвежий режим с трендом на уровне -9 в глубокой красной зоне несколько часов. Это был болезненный нисходящий тренд для тех, кто держал лонги. Затем что-то меняется — тренд пересекает нулевую линию и достигает +2, и ваш сигнал разворота срабатывает. Но вы дисциплинированы. Не входите сразу. Вместо этого ждете подтверждения, наблюдая, как тренд продолжает расти до +5. Теперь у вас есть уверенность. Вы входите в лонг, нацеливаясь на предыдущий уровень сопротивления, который был пробит во время падения. Режим официально развернулся, и вы на правильной стороне.
Третий сценарий, возможно, самый ценный — он показывает, как индикатор уберегает вас от проблем. Тренд внезапно подскакивает до +7, и менее опытные трейдеры могут поспешить войти. Но вы замечаете важный момент — индикатор объема на уровне -2. Эта дивергенция — красный флаг. Ваша система оповещений не срабатывает, потому что для сильных сигналов требуется подтверждение объемом. Вы остаетесь в стороне, наблюдая со стороны. Через несколько минут тренд возвращается в нейтральную зону. То, что выглядело как прорыв, оказалось ложным, и вы полностью избежали ловушки, потому что поняли полную картину, которую показывал Regime Filter.
🛡️ Отказ от ответственности
Прежде чем начать использовать этот индикатор, крайне важно понять, что он из себя представляет и что нет. Regime Filter — это инструмент технического анализа, предназначенный для помощи в принятии лучших торговых решений. Это не хрустальный шар, он не гарантирует прибыль и никогда не должен использоваться как самостоятельная торговая система без вашего собственного анализа и суждений.
Торговля на финансовых рынках связана с существенным риском потерь. Хотя Regime Filter разработан для более четкого определения рыночных условий, ни один индикатор не является на 100% точным. Ложные сигналы случаются. Рыночные условия могут измениться мгновенно, быстрее, чем любой индикатор успеет адаптироваться. Вы всегда должны использовать правильные методы управления рисками, включая стоп-лоссы и соответствующий размер позиций.
Прошлые результаты этого индикатора, показанные на скриншотах или описанные в примерах, не гарантируют будущих результатов. Каждый рынок уникален, каждый таймфрейм ведет себя по-разному, и ваши результаты будут зависеть от множества факторов, включая время входа, управление рисками и психологическую дисциплину.
Настоятельно рекомендую тщательно тестировать Regime Filter на демо-счетах перед риском реального капитала. Потратьте время, чтобы понять, как он ведет себя на ваших предпочтительных инструментах и таймфреймах. Ведите торговый журнал, чтобы отслеживать не только выигрыши и проигрыши, но и насколько хорошо вы интерпретируете сигналы индикатора. Этот процесс обучения бесценен и сэкономит вам деньги в долгосрочной перспективе.
Никогда не рискуйте более чем 1–2% от вашего счета в одной сделке, независимо от того, насколько сильной кажется ситуация. Всегда используйте стоп-лоссы — никогда не считайте сделку «гарантированной» на основе сигналов индикатора. Поддерживайте размер позиций, соответствующий размеру счета и уровню риска. Делайте регулярные перерывы в торговле, чтобы поддерживать эмоциональное равновесие и избегать торговли из мести после убытков.
Создатель этого индикатора, несмотря на значительные усилия по его разработке и тестированию, не может и не принимает на себя ответственность за торговые убытки, которые вы можете понести. Вы торгуете на свой страх и риск. Этот инструмент должен быть частью комплексного торгового плана, включающего различные виды анализа, правильное управление рисками и постоянное обучение.
Помните, что торговля — это марафон, а не спринт. Развитие стабильной прибыльности требует времени, практики и часто болезненных уроков. Используйте Regime Filter как один из инструментов в вашем арсенале, но никогда не полагайтесь на него исключительно. Сочетайте его с анализом ценового действия, уровнями поддержки и сопротивления, а также собственным пониманием рыночной динамики.
Помните: лучшие сделки происходят, когда у вас полная ясность рынка. Regime Filter дает вам эту ясность. Вопрос в том, готовы ли вы ее использовать?
Сводка
Customizable alerts notify users of strong bullish or bearish conditions, trend reversals when crossing the zero line, and regime changes indicating shifts in market character. The tool supports various trading styles: trend traders use it to enter positions when trend and volume align strongly; swing traders focus on extreme regime values with volume confirmation; scalpers trade only in strong regimes on lower timeframes.
Settings can be adjusted for different timeframes and markets, including volatile assets like cryptocurrencies. The indicator’s visual components include the trend histogram, volume confirmation line, zero reference line, and threshold markers at ±5. It is intended as a decision-support tool to enhance market clarity and should be used alongside proper risk management and additional analysis methods.
Отзывы покупателей
5 | 100 % | |
4 | 0 % | |
3 | 0 % | |
2 | 0 % | |
1 | 0 % |


