
FZ
Индикатор
Версия 1.0, Mar 2026
Windows, Mac
4.0
Отзывы: 2
Описание
Индикатор FZ для cTrader
Описание
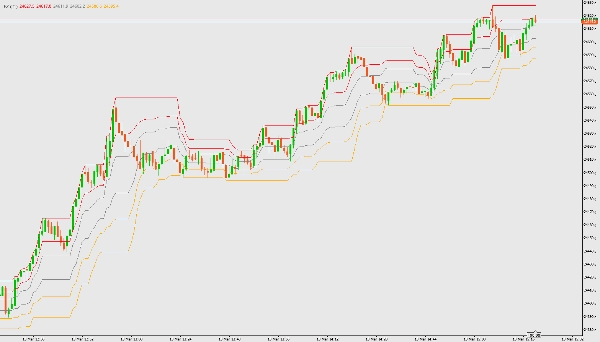
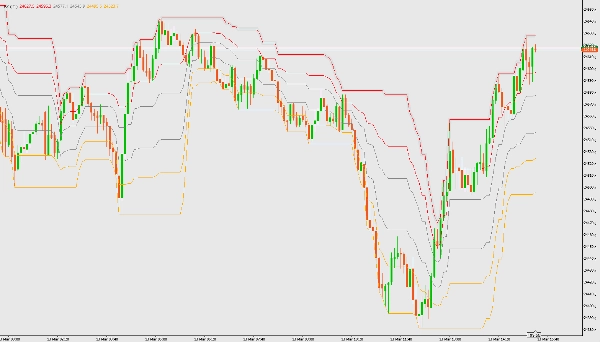
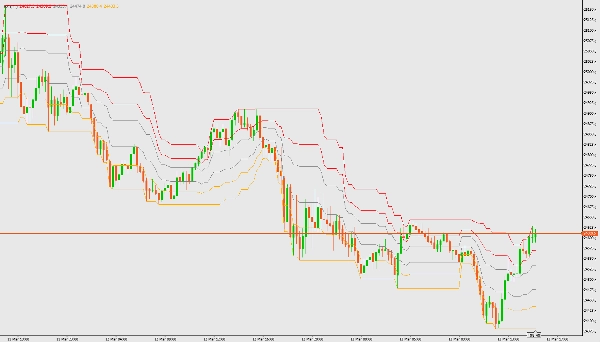
Индикатор FZ рисует зоны канала Фибоначчи на основе максимальных и минимальных цен за заданный пользователем период. Он помогает определить зоны тренда и потенциальные области разворота.
Особенности
- Вычисляет границы канала и уровни Фибоначчи (0.236, 0.382, 0.618, 0.786)
- Визуализирует зоны восходящего тренда, флэта и нисходящего тренда
- Накладывается на график цены
Параметры
- рассчитывать за последние ## баров: Количество баров для расчёта (по умолчанию: 21)
Как использовать
- Скачайте и добавьте файл индикатора FZ (FZ.cs) в вашу платформу cTrader.
- Скомпилируйте индикатор в cTrader Automate.
- Прикрепите индикатор к любому графику.
- Настройте параметр количества баров по необходимости.
- Интерпретируйте цветные зоны:
-
- Голубой: зона восходящего тренда (покупка)
- Серый: зона флэта (ожидание смены тренда)
- Оранжевый: зона нисходящего тренда (продажа)
Сводка
Профиль индикатора
Отзывы покупателей
4.0
Отзывы: 2
5 | 0 % | |
4 | 100 % | |
3 | 0 % | |
2 | 0 % | |
1 | 0 % |
Обсуждение
Частые вопросы
BTCUSD
Forex
Signal
Breakout
Indices
EURUSD
Commodities
GBPUSD
NZDUSD
Prop
Scalping
Crypto
Grid
Stocks
AI
XAUUSD
NAS100
USDJPY
Продукты, доступные в cTrader Store, включая торговых ботов, индикаторы и плагины, предоставляются сторонними разработчиками и доступны исключительно в информационных и технических целях. cTrader Store не является брокером и не предоставляет инвестиционные консультации, персональные рекомендации или какие-либо гарантии будущей доходности.
Больше от этого автора


Цена
С 10/03/2026
105
Бесплатные установки