
Sero
Индикатор
104 скачивания
Версия 1.0, Mar 2026
Windows, Mac
Описание
Sero — Осциллятор импульса
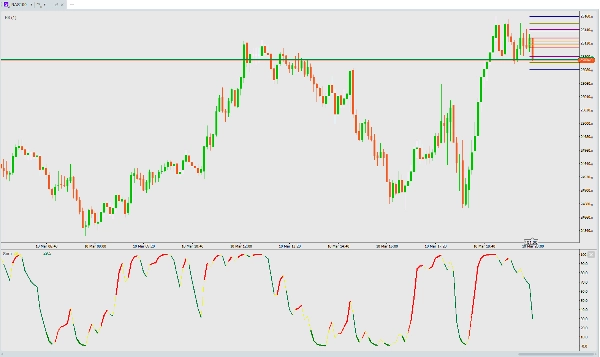
Sero — стохастический осциллятор импульса, который дает четкие, цветовые визуальные сигналы о смене рыночного импульса.
Как это работает
Sero вычисляет сглаженное стохастическое значение от Типичной цены (High+Low+Close)/3 за диапазон из 15 баров, затем применяет быстрый 2-периодный EMA для получения отзывчивого осциллятора с диапазоном 0–100.
На что обращать внимание
Цвета рассказывают историю:
- Желтая линия — базовое значение Sero (всегда видно)
- Красная линия — бычий импульс (Sero растет)
- Толстая красная линия — сильный бычий импульс (растет + выше 20 — подтверждение прорыва из зоны перепроданности)
- Зеленая линия — медвежий импульс (Sero падает)
- Толстая зеленая линия — сильное медвежье падение (падает + ниже 20 — глубоко в зоне перепроданности)
Ключевые сигналы:
- Сигнал на покупку — смена цвета с Зеленого на Красный, особенно при переходе из зоны ниже 20 (разворот из перепроданности)
- Сигнал на продажу — смена цвета с Красного на Зеленый, особенно при переходе из зоны выше 80 (разворот из перекупленности)
- Сильный тренд — толстые линии подтверждают силу импульса
- Истощение — толстая зеленая линия ниже 20 = продавцы могут терять силу, ожидайте разворота
Лучшие практики
- Работает на любом таймфрейме и любом инструменте
- Комбинируйте с ценовым действием или уровнями поддержки/сопротивления для подтверждения
- Переходы цвета возле экстремумов (0 или 100) — сигналы с наивысшей вероятностью
- Настройки не требуются — оптимизирован и готов к использованию сразу
Сводка
ИИ-сводка
Sero is a stochastic-based momentum oscillator designed to identify market momentum shifts through clear, color-coded visual signals. It calculates a smoothed stochastic value from the Typical Price [(High + Low + Close) / 3] over a 15-bar range, then applies a fast 2-period exponential moving average (EMA) to generate a responsive oscillator ranging from 0 to 100.
The indicator displays multiple colored lines to represent momentum states:
- Yellow line: base Sero value (always visible)
- Red line: bullish momentum (rising oscillator)
- Thick red line: strong bullish momentum (rising and above 20, indicating breakout from oversold)
- Green line: bearish momentum (falling oscillator)
- Thick green line: strong bearish momentum (falling and below 20, indicating deep oversold conditions)
Key signals include buy signals when the color flips from green to red, especially below 20 (oversold reversal), and sell signals when it flips from red to green, especially above 80 (overbought reversal). Thick lines confirm strong momentum trends, while thick green lines below 20 may indicate exhaustion of selling pressure and potential reversal.
Sero works on any timeframe and instrument without requiring user settings, and it is recommended to combine it with price action or support/resistance levels for confirmation. Color transitions near extremes (0 or 100) provide the highest-probability signals.
Профиль индикатора
Отзывы покупателей
0.0
Отзывы: 0
Отзывы покупателей
У этого продукта еще нет отзывов. Уже попробовали его? Поделитесь впечатлениями!
Обсуждение
Частые вопросы
BTCUSD
Forex
Signal
Indices
EURUSD
Commodities
GBPUSD
NZDUSD
Crypto
Stocks
XAUUSD
NAS100
USDJPY
Продукты, доступные в cTrader Store, включая торговых ботов, индикаторы и плагины, предоставляются сторонними разработчиками и доступны исключительно в информационных и технических целях. cTrader Store не является брокером и не предоставляет инвестиционные консультации, персональные рекомендации или какие-либо гарантии будущей доходности.
Больше от этого автора


Цена
С 10/03/2026
104
Бесплатные установки