
Описание
ЧТО ОН ДЕЛАЕТ
Supertrend Moving Average решает основное ограничение традиционных скользящих средних: фиксированные периоды, которые никогда не адаптируются к тому, как тренды действительно развиваются.
Короткие периоды реагируют быстро, но часто дают ложные сигналы. Длинные периоды сглаживают шум, но сильно отстают во время сильных движений. Независимо от настройки, вам приходится угадывать число и надеяться, что рынок будет сотрудничать.
Этот индикатор устраняет эту неопределённость.
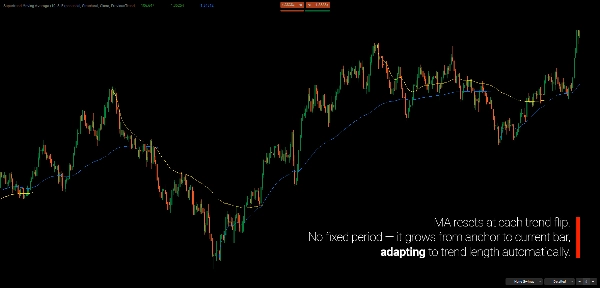
Вместо усреднения цены по произвольному количеству баров, он вычисляет скользящую среднюю с момента, когда текущий тренд структурно начинается. Чем дольше длится тренд, тем длиннее становится скользящая средняя. Короткие тренды остаются отзывчивыми. Продолжительные тренды становятся более плавными — автоматически.
В результате получается скользящая средняя, которая растёт вместе с трендом, а не против него.
Привязанная к структурным изменениям на основе Supertrend, эта скользящая средняя адаптируется к ритму рынка в реальном времени, без оптимизации, подгонки под кривую или ручной настройки. Структура определяет период — а не трейдер.
ПОЧЕМУ СТРУКТУРНЫЙ SUPERTREND?
Оригинальный Supertrend меняет направление, когда цена закрывается за пределами своей полосы. Это хорошо работает в чистых трендах, но создаёт распространённую проблему: ложные сигналы в условиях флетового рынка.
Проблема
Одна волатильная свеча, закрывающаяся чуть за пределами полосы, вызывает смену направления — даже если более широкий тренд остаётся неизменным. Трейдеры, использующие оригинальный Supertrend, часто сталкиваются с:
- Ложными сигналами во время консолидации
- Преждевременным выходом из действительных трендов
- Повторными входами по худшим ценам после ложных разворотов
Решение
Структурный Supertrend расширяет концепцию оригинального Supertrend, чтобы лучше отражать структурные сдвиги, а не моментальную волатильность. Он фильтрует шум, ожидая подтверждения, что произошла настоящая смена направления.
В результате получается меньше ложных смен и лучшее соответствие реальным изменениям тренда.
Зачем использовать оба?
Оригинальный Supertrend не бесполезен — он отвечает на другой вопрос.
- Структурный показывает основной тренд (общую картину)
- Оригинальный показывает сдвиги импульса внутри этого тренда (импульс против коррекции)
Когда обе линии совпадают: сильная уверенность в направлении. Когда они расходятся: движение может быть коррекционным, а не настоящим разворотом.
Этот двухслойный взгляд даёт контекст, который ни одна линия не предоставляет по отдельности.
ОСНОВНАЯ КОНЦЕПЦИЯ
Традиционные скользящие средние отвечают на вопрос: «Какова средняя цена за N баров?»
Этот индикатор отвечает: «Какова средняя цена с момента начала текущего тренда?»
Скользящая средняя строится непосредственно на основе Supertrend:
- Supertrend обнаруживает смену тренда
- Индикатор находит экстремальное закрытие предыдущего тренда (максимум для нового нисходящего тренда, минимум для нового восходящего)
- Скользящая средняя привязывается к этой точке и рассчитывается вперёд до текущего бара
- При следующей смене Supertrend скользящая средняя сбрасывается на новую точку привязки
Supertrend определяет тренд. Скользящая средняя измеряет его. Они работают как единая система — а не как отдельные инструменты.
Вы выбираете, какой Supertrend управляет скользящей средней:
- Структурный — меньше сбросов, отслеживает основной тренд
- Оригинальный — больше сбросов, отслеживает краткосрочный импульс
КЛЮЧЕВЫЕ ОСОБЕННОСТИ
Двойной анализ Supertrend
- Структурный Supertrend определяет направление основного тренда с помощью структурно адаптированной модели Supertrend
- Оригинальный Supertrend показывает импульсное и коррекционное поведение внутри тренда
- Визуальное сравнение показывает, когда обе линии совпадают (уверенность) и когда расходятся (осторожность)
Адаптивная скользящая средняя с привязкой
- Скользящая средняя автоматически привязывается к экстремальному закрытию предыдущего тренда
- Период динамически растёт от точки привязки — фиксированные настройки не требуются
- Три типа скользящих средних: простая, экспоненциальная, Arnaud Legoux (ALMA)
- Цветовая кодировка по направлению тренда для мгновенного распознавания смещения
Контекст мультивременных интервалов
- Применяйте расчёт скользящей средней к Supertrend на более высоком таймфрейме, просматривая графики на более низком
- Смотрите дневной тренд скользящей средней на вашем H1 графике без переключения таймфреймов
- Автоматическое определение необходимого количества баров с чёткими предупреждениями
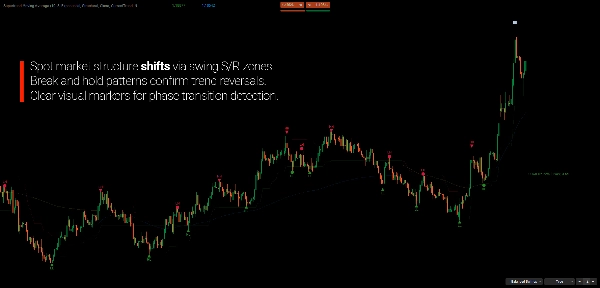
Интегрированное обнаружение разворотов
- Три режима обнаружения: Minor, Balanced, Major
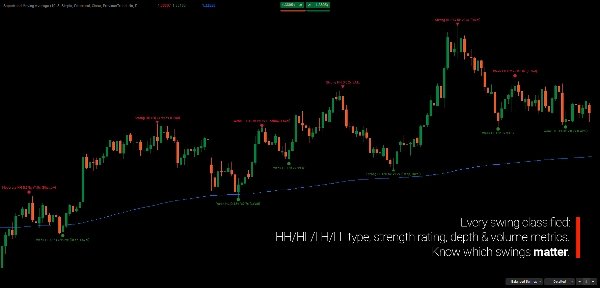
- Классификация силы разворота (Слабый, Умеренный, Сильный)
- Метки HH/HL/LH/LL подтверждают структуру тренда
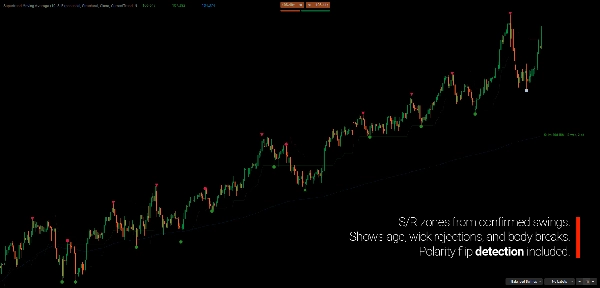
- Опциональные зоны поддержки/сопротивления с отслеживанием смены полярности
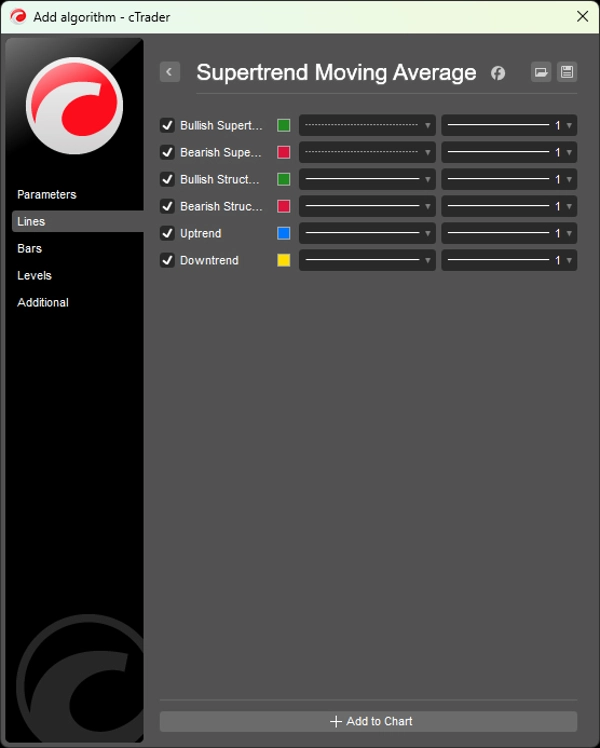
ЧТЕНИЕ ГРАФИКА
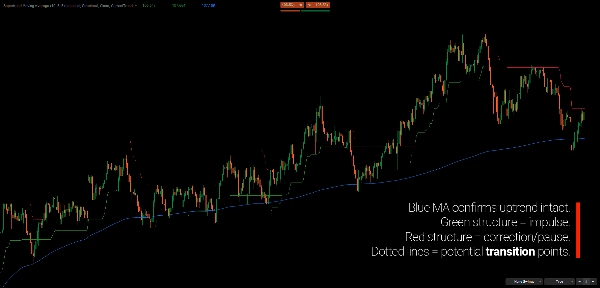
- Зелёная структурная линия: Бычий структурный тренд (поддержка)
- Красная структурная линия: Медвежий структурный тренд (сопротивление)
- Пунктирная линия: Оригинальный Supertrend — показывает, когда структура отличается от классической
- Синяя скользящая средняя: Средняя восходящего тренда от точки привязки
- Жёлтая скользящая средняя: Средняя нисходящего тренда от точки привязки
- Маркер разворотов: Подтверждённые точки поворота с иконками силы
Проверка согласованности тренда:
- Структура + Оригинальный совпадают → движение с высокой уверенностью
- Структура + Оригинальный расходятся → возможная коррекция или переход
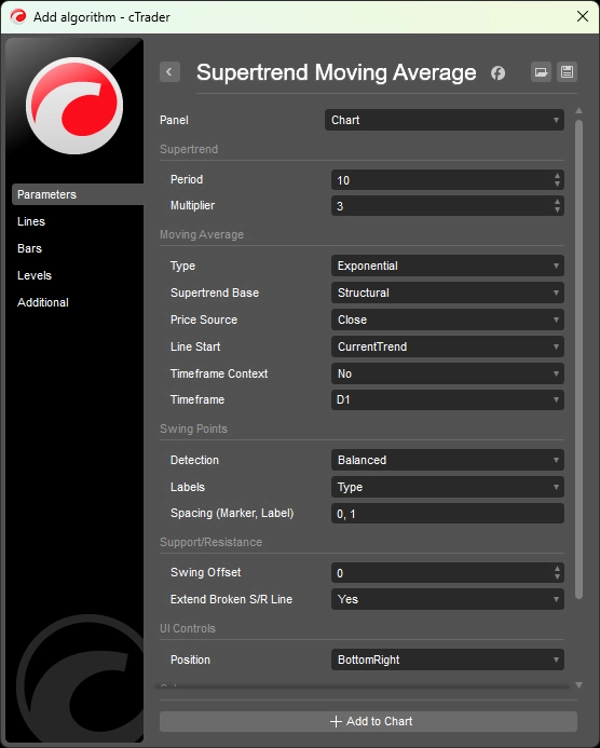
ПАРАМЕТРЫ
Supertrend
- Период (по умолчанию: 10)
- Множитель (по умолчанию: 3.0)
Скользящая средняя
- Тип: Нет, Простая, Экспоненциальная, Скользящая средняя Арно Легу (ALMA)
- База Supertrend: Структурный (по умолчанию) или Оригинальный
- Источник цены: Закрытие, Открытие, Максимум, Минимум, Медиана, Типичная, Средняя
- Начало линии: Текущий тренд или Предыдущий тренд
- Контекст таймфрейма: Включение/отключение с выбором таймфрейма
Точки разворота
- Режим обнаружения: Нет, Minor, Balanced, Major
- Отображение меток: Нет, Тип (HH/LL), Подробно
- Настраиваемые цвета и расстояния
ДЛЯ КОГО ОН
Этот индикатор предназначен для трейдеров, которые мыслят в терминах структуры, а не сигналов.
Если вам важнее понимать, где вы находитесь внутри тренда, чем гнаться за идеальными входами, этот инструмент создан для вас.
Он хорошо подходит для трендовых и свинг-трейдеров, которые хотят объективно отслеживать развитие тренда без опоры на скользящие средние с фиксированным периодом или постоянную оптимизацию параметров.
Аналитики мультивременных интервалов получат выгоду, видя структурный контекст более высокого таймфрейма прямо на графиках исполнения, в то время как дискреционные трейдеры могут использовать привязанную скользящую среднюю как динамическую опору для откатов, продолжения и истощения тренда.
Это не генератор сигналов «включи и торгуй». Это контекстуальная основа для трейдеров, которые ценят ясность, последовательность и структурную логику в принятии решений.
ЧТО ДЕЛАЕТ ЕГО ОСОБЕННЫМ
Торговые решения часто связаны с известной дилеммой: быстро, но шумно, или плавно, но с запозданием.
Этот индикатор адаптируется к тому, как рынок действительно развивается. Короткие тренды дают отзывчивые скользящие средние. Продолжительные тренды естественно становятся более плавными. Оптимизация не требуется — период определяет структура.
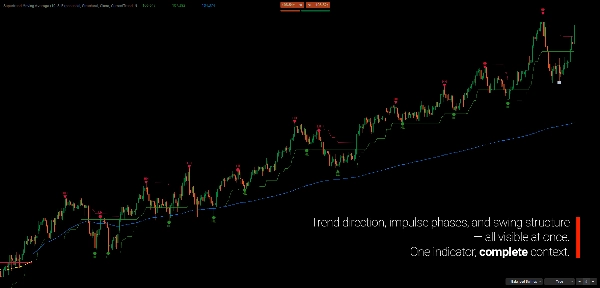
Сравнивая структурный и оригинальный Supertrend, индикатор даёт чёткий контекст для различения продолжения тренда и коррекционного движения внутри тренда.
---
ПОНИМАНИЕ СТРУКТУРЫ РЫНКА
Структура рынка — это изучение того, как цена развивается через последовательности расширения и сжатия, а не через отдельные свечи или индикаторы. Тренды определяются не отдельными движениями, а отношениями между колебаниями — более высокими максимумами и более высокими минимумами в восходящих трендах, более низкими максимумами и более низкими минимумами в нисходящих.
С этой точки зрения тренд — это не то, что нужно предсказывать, а то, что нужно наблюдать и подтверждать. Важно не то, растёт ли цена или падает на текущем баре, а то, сохраняется ли основная структура или начинает разрушаться.
Именно поэтому анализ на основе структуры меньше ориентирован на точное время входа и больше на контекст: где находится рынок в своей текущей фазе, являются ли движения импульсивными или коррекционными, и как новая информация вписывается в существующую структуру.
Индикаторы, построенные вокруг структуры рынка, не предназначены для замены принятия решений, а для поддержки более ясной интерпретации того, что цена уже сообщает.
---
Торговля связана с риском. Этот индикатор является инструментом технического анализа — всегда применяйте надлежащее управление рисками.
Сводка
The indicator integrates dual Supertrend analyses: a Structural Supertrend that identifies major trend direction by filtering out noise and confirming genuine directional changes, and the Original Supertrend that highlights momentum shifts within the trend. Comparing these two provides context for distinguishing strong trend continuation from corrective movements.
Key features include:
- Adaptive anchor-based moving averages with options for Simple, Exponential, or Arnaud Legoux (ALMA) types.
- Multi-timeframe capability to apply higher timeframe Supertrend context on lower timeframe charts.
- Integrated swing detection with configurable modes and strength classification.
- Color-coded trend lines and swing markers for clear visual interpretation.
This tool is suited for trend and swing traders, multi-timeframe analysts, and discretionary traders seeking a structural framework to track trend development and market rhythm objectively. It emphasizes market structure and context over fixed signals, supporting clearer interpretation of price behavior.
Отзывы покупателей
5 | 100 % | |
4 | 0 % | |
3 | 0 % | |
2 | 0 % | |
1 | 0 % |


![Логотип продукта "[Stellar Strategies] Inside Bar with Signals"](https://cdn.ctrader.com/image/webp/1d9e8bfa-3b2c-4440-bb37-5856902008a7_30683)