
Описание
ЧТО ОН ДЕЛАЕТ
Fibonacci Channel решает проблему, которую игнорируют большинство инструментов Фибоначчи: куда вы закрепляете якорь, важнее, чем какие уровни вы рисуете.
Большинство трейдеров применяют уровни Фибоначчи вручную — выбирая максимум и минимум колебания, рисуя инструмент и надеясь, что структура удержится. В итоге получается статичный снимок, который теряет актуальность в момент, когда цена выходит за пределы любого из экстремумов.
Этот индикатор меняет подход.
Вместо закрепления за фиксированным колебанием Fibonacci Channel привязывается к выбранной вами точке и непрерывно отслеживает самый высокий максимум и самый низкий минимум от этого якоря до текущего бара. По мере расширения диапазона канал расширяется вместе с ним. Уровни Фибоначчи всегда отражают фактический диапазон, который сформировался — а не историческую догадку.
Канал растет вместе с рынком. Уровни остаются значимыми.
Направление отслеживается автоматически. В бычьем контексте уровни измеряются сверху вниз. В медвежьем — снизу вверх. Ручная корректировка не требуется — индикатор считывает структуру и ориентируется соответственно.
ПОЧЕМУ ФИБОНАЧЧИ НА ОСНОВЕ ЯКОРЯ?
Проблема
Стандартные инструменты Фибоначчи рисуются между двумя фиксированными точками. В момент, когда цена превышает любой из экстремумов, инструмент становится недействительным — его нужно перерисовывать вручную. Это создает постоянный цикл корректировок, и карта Фибоначчи никогда не отражает полный диапазон, который фактически сформировался.
Есть и более глубокая проблема: где вы размещаете якорь, определяет всё. Произвольное размещение дает произвольные уровни.
Решение
Fibonacci Channel дает вам осознанный контроль над точкой якоря — а затем автоматически обрабатывает всё остальное. Разместите якорь на структурно значимом баре (начало тренда, ключевой разворот, открытие сессии), и индикатор построит полный диапазон вперед от этой точки. Каждый новый максимум или минимум, который формирует рынок, становится частью канала. Уровни Фибоначчи обновляются в реальном времени.
Якорь можно перетаскивать. Переместите его на графике, и весь канал мгновенно перерисуется.
Зачем нужны разные режимы?
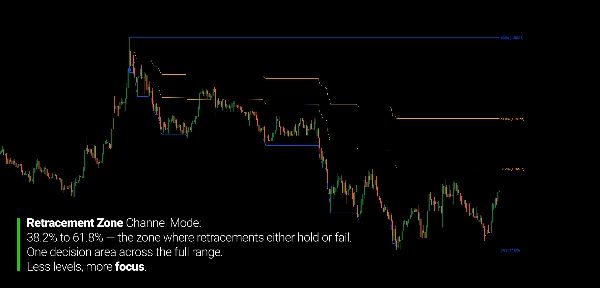
Полная сетка Фибоначчи не всегда нужна. Иногда внимание сосредоточено на зоне отката между 38,2% и 61,8%. Иногда нужно выделить структуру только в верхней или нижней половине диапазона.
Семь различных режимов канала позволяют применять именно тот уровень детализации, который требует ситуация — без загромождения графика уровнями, которые вы не используете.
ОСНОВНАЯ КОНЦЕПЦИЯ
Индикатор работает в одном проходе вперед от якоря:
- Вы размещаете иконку якоря на выбранном баре
- От этого бара вперед индикатор отслеживает текущий самый высокий максимум и самый низкий минимум
- Границы канала (Верхняя линия, Нижняя линия) отражают этот расширяющийся диапазон
- Уровни Фибоначчи рассчитываются внутри диапазона, ориентируясь по направлению тренда
- Переместите якорь — канал пересчитывается мгновенно
Направление тренда определяется сравнением текущей цены закрытия с ценой открытия якорного бара. Быки: уровни измеряются сверху вниз от максимума. Медведи: уровни измеряются снизу вверх от минимума. При изменении направленности рынка канал автоматически переориентируется.
Якорь привязывается к времени и цене открытия бара для точного и воспроизводимого размещения.
РЕЖИМЫ КАНАЛА
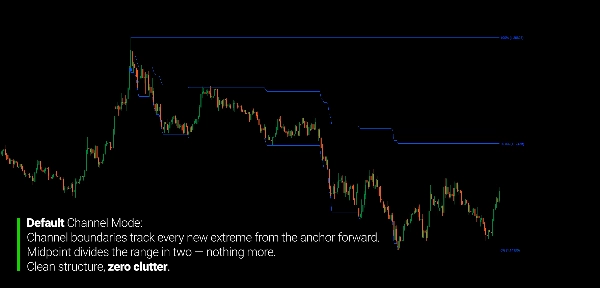
По умолчанию Только Верхняя линия, Нижняя линия и Средняя линия. Чистый вид границ диапазона без внутренних уровней.
Зона отката Добавляет уровни 61,8% и 38,2% — основную зону отката внутри полного диапазона. Лучший вариант для определения основной зоны отката внутри движения.
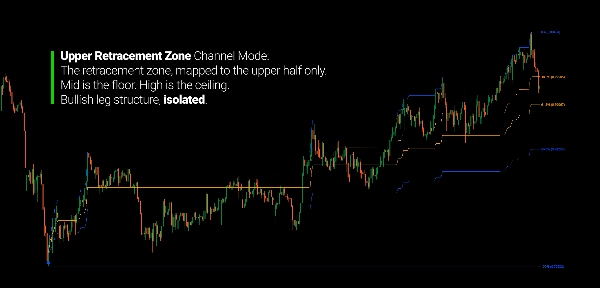
Верхняя зона отката Зона отката, нанесенная на верхнюю половину канала (между Средней и Верхней линиями). Полезно для выделения структуры отката в восходящем движении.
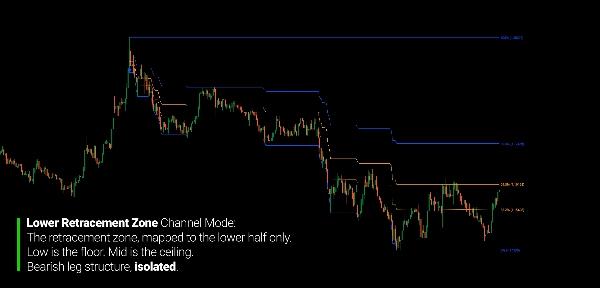
Нижняя зона отката Зона отката, нанесенная на нижнюю половину (между Нижней и Средней линиями). Та же логика применяется к нисходящим движениям.
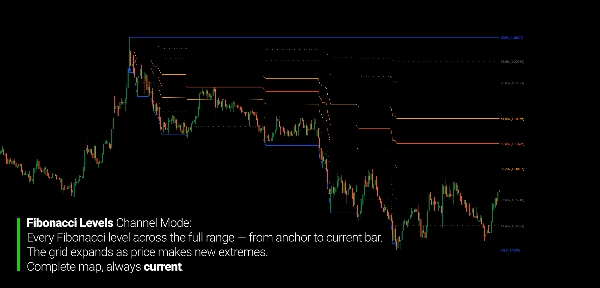
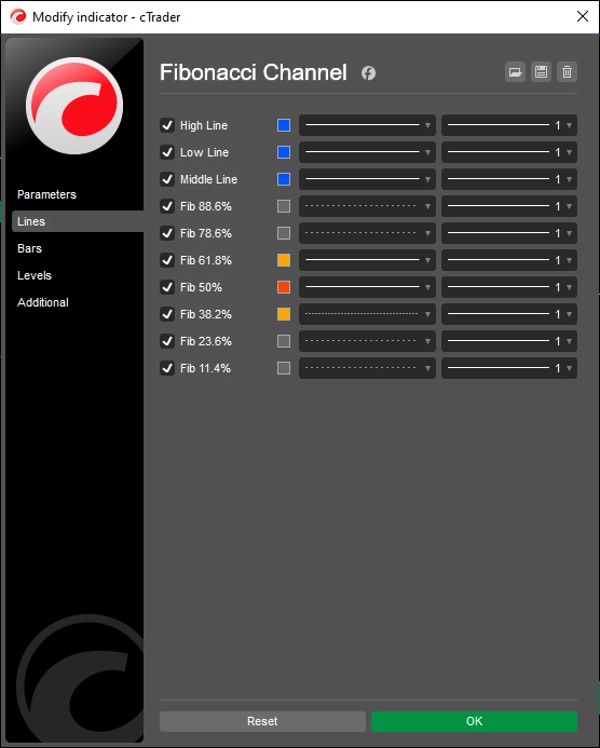
Уровни Фибоначчи Полная сетка Фибоначчи по всему диапазону: 88,6%, 78,6%, 61,8%, 50%, 38,2%, 23,6%, 11,4%. Для трейдеров, которым нужна полная карта уровней.
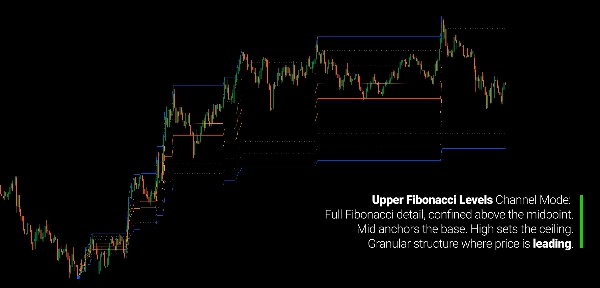
Верхние уровни Фибоначчи Полная сетка Фибоначчи, применяемая только к верхней половине канала.
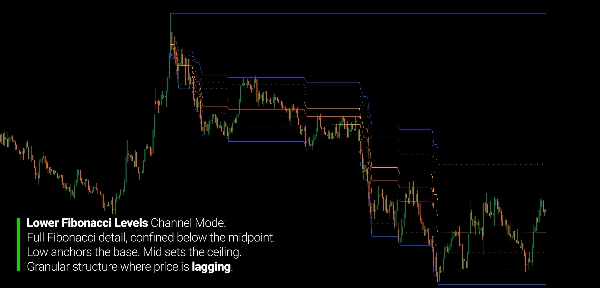
Нижние уровни Фибоначчи Полная сетка Фибоначчи, применяемая только к нижней половине канала.
ЧТЕНИЕ ГРАФИКА
- Верхняя линия: Верхняя граница канала (самый высокий максимум от якоря)
- Нижняя линия: Нижняя граница канала (самый низкий минимум от якоря)
- Средняя линия: Средняя точка полного диапазона
- 61,8% / 38,2%: Основная зона отката (оранжевые линии)
- 50%: Уровень среднего отката (красно-оранжевый)
- 78,6% / 88,6% / 23,6% / 11,4%: Расширенные уровни Фибоначчи (серые пунктирные)
- Иконка якоря: Перетаскиваемая — переместите её, чтобы переопределить начало канала
Справка по направлению:
- Бычий контекст → уровни ориентируются сверху вниз (Верх = 0%, Низ = 100%)
- Медвежий контекст → уровни ориентируются снизу вверх (Низ = 0%, Верх = 100%)
- Направление обновляется автоматически, когда последний закрывающийся бар пересекает открытие якоря
ПАРАМЕТРЫ
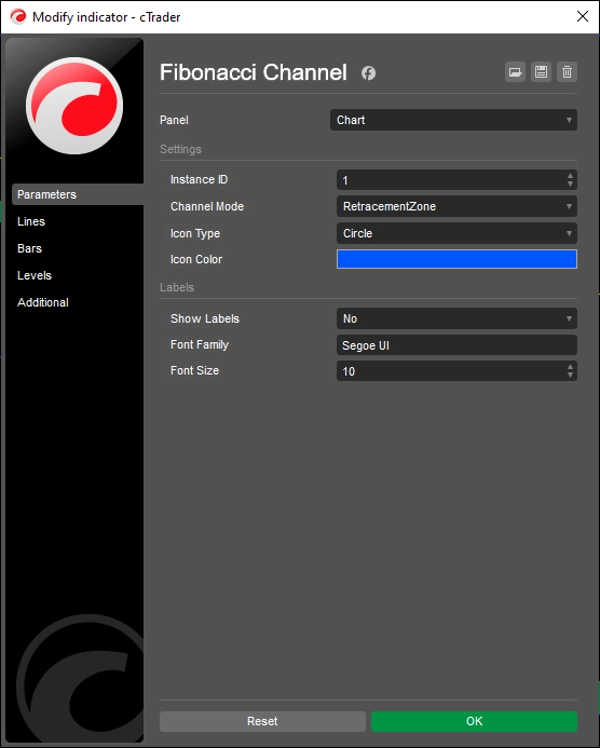
Настройки
- ID экземпляра — поддерживает несколько независимых каналов на одном графике
- Режим канала — выбирает, какие уровни отображать (7 режимов)
- Тип иконки — визуальный стиль перетаскиваемого якоря
- Цвет иконки — цвет маркера якоря
Метки
- Показывать метки — переключатель ценовых меток на каждом уровне
- Семейство шрифтов — тип шрифта меток
- Размер шрифта — размер меток (6–32)
ДЛЯ КОГО ОН
Этот индикатор предназначен для трейдеров, которые используют анализ Фибоначчи как структурную справку, а не как механический инструмент сигналов.
Если вы тратили время на перерисовку инструментов Фибоначчи каждый раз, когда цена достигает нового экстремума, или замечали, что статичные уровни перестают отражать рынок после первых нескольких баров, этот индикатор создан именно для решения этой задачи.
Он хорошо подходит для свинг- и позиционных трейдеров, которые хотят иметь карту Фибоначчи, остающуюся актуальной по мере развития цены, трейдеров диапазона и структуры, работающих с границами каналов и зонами отката как ориентирами для входа или выхода, и пользователей с несколькими экземплярами, которые хотят отслеживать несколько независимых каналов на одном инструменте одновременно.
Перетаскиваемый якорь делает его удобным для использования в реальном времени: установите начало канала в структурно важной точке, и индикатор будет поддерживать карту оттуда. Без перерисовок, без ручных обновлений.
Это не генератор сигналов. Это структурная справочная рамка для трейдеров, которые используют уровни Фибоначчи как контекст — а не как триггеры для входа.
ЧТО ДЕЛАЕТ ЕГО ОСОБЕННЫМ
Большинство инструментов Фибоначчи статичны: две фиксированные точки, одна фиксированная карта. Этот динамичен — диапазон расширяется по мере развития цены, и уровни всегда отражают фактический диапазон от выбранного вами якоря до текущего бара.
Большинство реализаций Фибоначчи требуют ручной настройки направления. Этот автоматически определяет бычий и медвежий контекст и ориентирует все уровни соответственно — без изменений параметров со стороны трейдера.
Большинство инструментов каналов предлагают один вариант отображения. Этот предлагает семь различных режимов — от чистого вида границ до полной сетки Фибоначчи, применяемой к полному диапазону или к каждой половине отдельно. График показывает именно тот уровень детализации, который нужен для анализируемого контекста.
Несколько экземпляров могут работать одновременно с независимыми якорями — каждый отслеживает отдельный структурный сегмент, не мешая друг другу.
---
ПОНИМАНИЕ СТРУКТУРЫ ФИБОНАЧЧИ
Соотношения Фибоначчи не являются предсказательными. Они описывают пропорциональные отношения внутри ценовых диапазонов — отношения, которые трейдеры наблюдали повторяющимися на рынках и таймфреймах десятилетиями. Отражают ли они математические свойства рынков или просто коллективное поведение вокруг известных уровней — открытый вопрос. Для практического использования важнее другое.
Канал Фибоначчи определяет диапазон движения и делит его на пропорционально значимые зоны. Трейдеры используют эти зоны, чтобы оценить, является ли откат мелким или глубоким, удерживается ли уровень отката или проваливается, и приближается ли цена к области, где структура исторически была значимой.
Ценность подхода на основе якоря в том, что он сохраняет анализ привязанным к конкретному структурному событию. Канал не начинается в произвольной точке — он начинается там, где вы решаете, что релевантное движение стартовало. Это решение принимаете вы, исходя из прочтения графика. Роль индикатора — точно поддерживать карту от этой точки вперед, чтобы уровни оставались валидными, пока структура, которую они измеряют, остается целой.
---
Торговля связана с риском. Этот индикатор — инструмент технического анализа — всегда применяйте надлежащее управление рисками.
Сводка
Отзывы покупателей
5 | 100 % | |
4 | 0 % | |
3 | 0 % | |
2 | 0 % | |
1 | 0 % |


